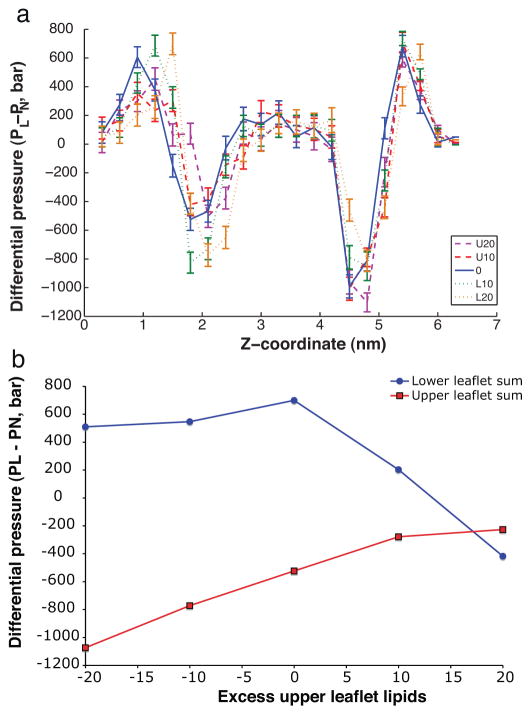
Fig. 4.
Surface tension profiles for membrane-protein simulations with different numbers of lipids. Plotted in (a) are differential pressures for five simulations: the original GLIC-bilayer system in blue, the systems with 20 and10 lipids removed from the upper leaflet (U20, U10) in purple and red respectively, and the systems with 20 and 10 lipids removed from the lower leaflet (L20, L10) in orange and green respectively. The surface tension for each leaflet is plotted in (b) as a function of number excess upper-leaflet lipids relative to standard solvation methods. In order to consider bulk membrane properties, lipids within 9A of the protein were excluded from this analysis. (For interpretation of the references to color in this figure legend, the reader is referred to the web version of the article.)

