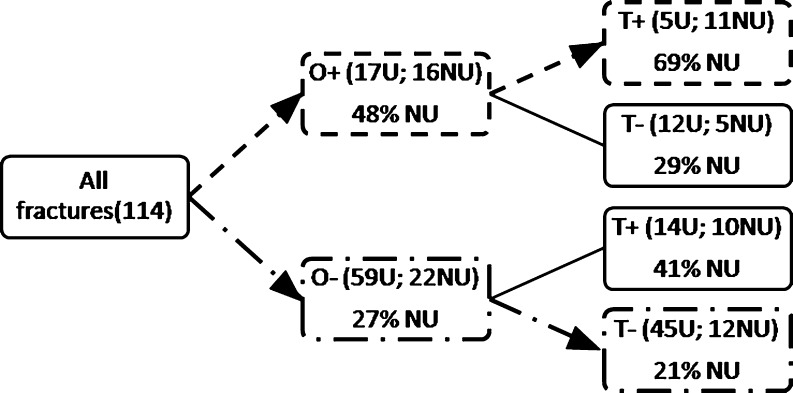
Fig. 1.
Diagram analysis of the 114 fractures. Among the patients that presented open fractures associated with tobacco, 69 % had a nonunion versus 21 % for patients presenting closed fractures without tobacco used. This was a statistically significant difference with p < 0.001 and OR = 8.25, 95% CI (2.4–28.34). O+ open fracture, O− closed fracture, T+ smoking, T− no smoking, U union, NU nonunion

