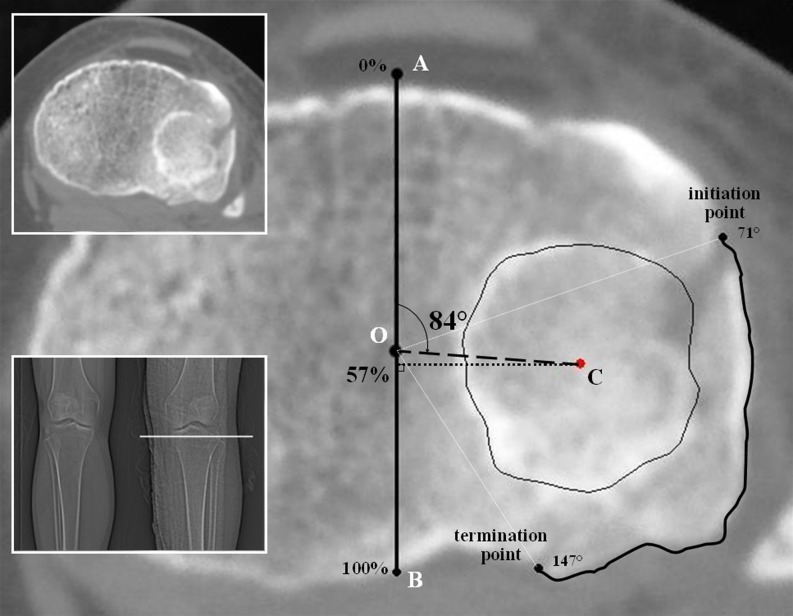
Fig. 1.
Radiographic measurements: in computed tomography (CT) transverse view. Two smaller figures showed the section and fracture. Point O and Point A: projections of the midpoint of two tibial intercondylar eminences and the most anterior point of tibial tuberosity. Point B: intersection of line AO and posterior edge. Point C: centre of articular depression region. In this case, the discontinuity arc is from 71° to 147°, the angle of depression centre (ADC) was 84°, the anterior-posterior position of depression centre (APDC) was 57 %, and the posterolateral cortex is broken

