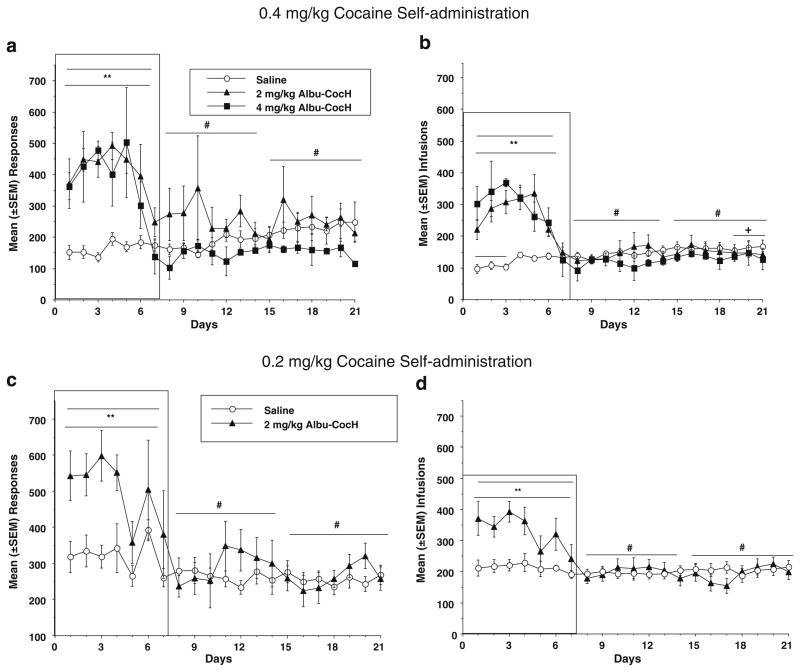
Fig. 2.
Mean (±SEM) responses (a and c) and cocaine infusions (b and d) are presented for groups self-administering 0.4 mg/kg cocaine (a and b) and treated with saline (open circles), 2 mg/kg Albu-CocH (triangles), or 4 mg/kg Albu-CocH (squares) and groups (c and d) self-administering 0.2 cocaine and treated with saline (open circles) or 2 mg/kg Albu-CocH (triangles). Albu-CocH or saline treatment was given on the first 7 (shown in box) of the 21 days. The asterisks indicate a significant group difference in responses (a and c) and infusions (b and d) during the first 7 days when Albu-CocH vs saline pretreatment occurred daily before the sessions. Pound signs indicate significant within-group differences in the first 7-day block vs the second and/or third 7-day blocks. The plus sign indicates significant increase (escalation) of cocaine infusions in the saline group when the first three and last three sessions were compared in the group self-administering 0.4 mg/kg cocaine (b)

