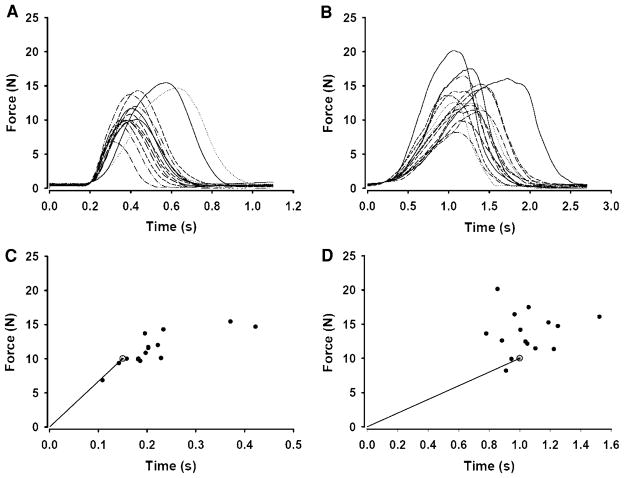
Fig. 1.
Representative endpoint accuracy trials for fast and slow contractions. a The force–time profiles for a block of 15 trials during fast isometric contractions to a target force that was set at 80% of MVC force. b The force–time profiles for a block of 15 trials for the same subject during slow isometric contractions to a target force that was 80% of MVC force. c, d Corresponding endpoints (peak force and time to peak force) relative to the target (gray circle) for the fast and slow trials shown in a and b, respectively

