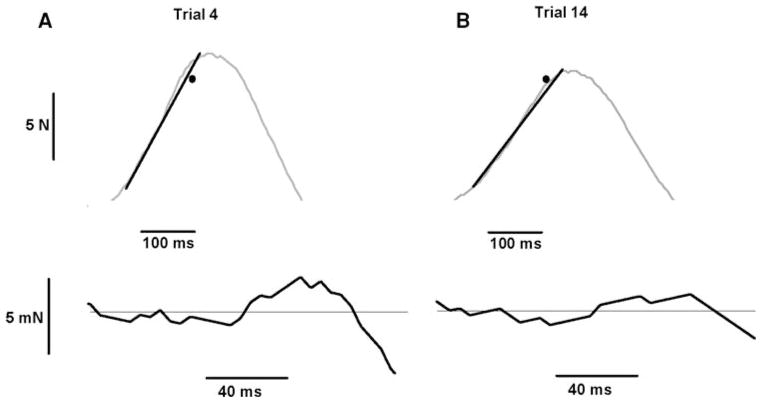
Fig. 2.
Representative endpoint accuracy trials for a single subject and the associated force trajectory SDs and force–time target (black dot) for the trials. a The force–time profile (top panel) for a trial during a fast isometric contraction to a target of 80% of MVC force and the corresponding force trajectory SD (bottom panel) for the same trial. b The force–time profile (top panel) for a trial during a fast isometric contraction to a target of 80% of MVC force and the corresponding force trajectory SD (bottom panel) for the same trial. The force trajectory SD was calculated as the SD of the detrended force signal from force onset to peak force (distance between dashed lines) and was 2.60 mN for the trial shown in a and 1.44 mN for the trial shown in b

