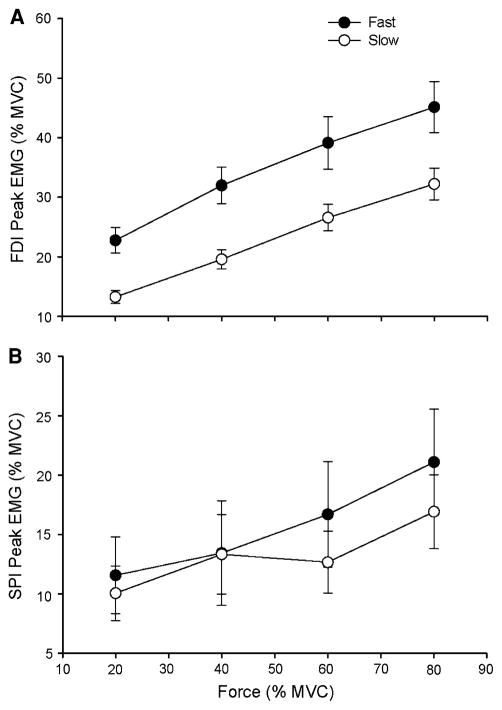
Fig. 7.
The peak EMG amplitudes of the agonist (FDI) and antagonist (SPI) muscles for the fast and slow contractions as a function of target force. Each data point corresponds to the mean ± SE for 1 block of 15 trials at each target force for fast (filled circles) and slow (open circles) contractions. a The FDI peak EMG increased linearly with target force for the fast and slow contractions (P < 0.001) and was greater for the fast contractions compared with the slow contractions (P < 0.001). b There was no significant change in SPI peak EMG (P = 0.283) as a function of target force for the fast and slow contractions. There was no main effect for SPI peak EMG across contraction speed (P = 0.07)

