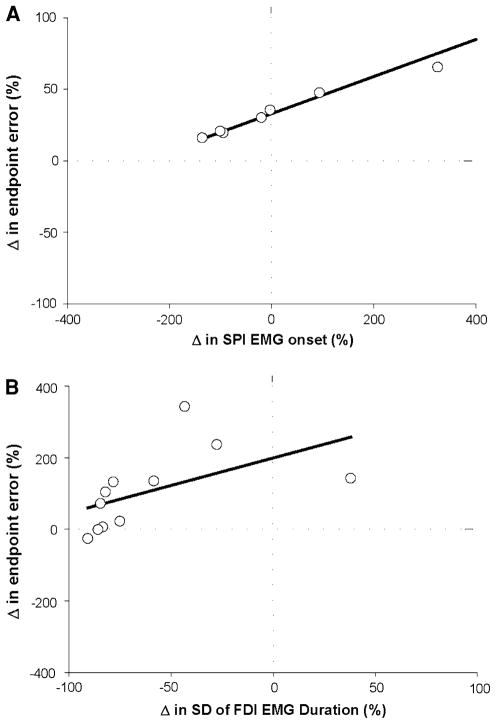
Fig. 8.
Prediction of the change (increase) in endpoint error for fast contractions relative to slow contractions at 60% and 80% of MVC. Each open circle in the two panels represents that data from one subject. a Stepwise, multiple linear regression analysis indicated that the change (increase) in endpoint error at 60% MVC was strongly predicted (R2 = 0.75; adjusted R2 = 0.71; P < 0.001) by the difference in SPI EMG onset for the slow and fast contractions (part r = 0.87). b Stepwise, multiple linear regression analysis indicated that the change (increase) in endpoint error at 80% MVC was strongly predicted (R2 = 0.73; adjusted R2 = 0.69; P < 0.001) by the difference in FDI EMG duration (part r = 0.85) for the slow and fast contractions

