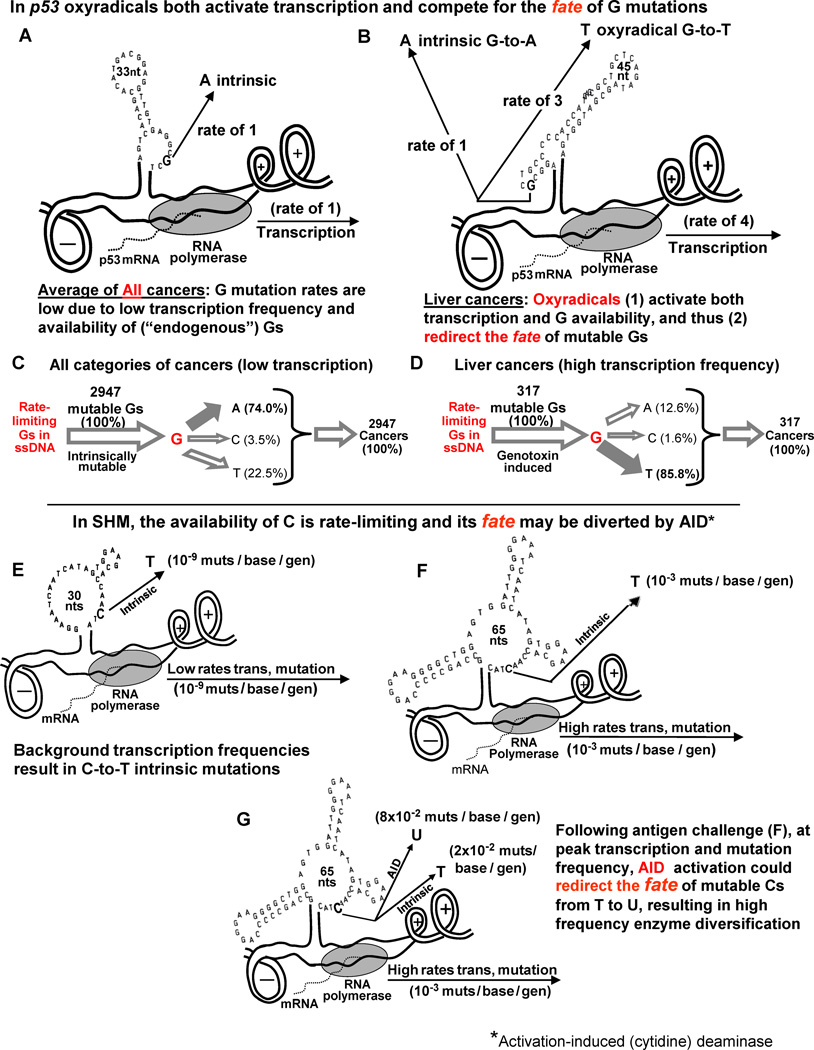
Fig. 5.
Kinetic models of the fate of intrinsically mutable Gs in p53 and Cs in SHM. Top Half: (A and C) The frequency of G mutations in All cancers (at background levels of transcription in the absence of mutagens) is low, due to the low frequency of transcription in which the majority of mutations (74.0 percent) are G-to-A (intrinsic) compared with liver cancers. (B and D) Oxyradicals activate transcription (about 4-fold) as well as G availability, thereby diverting most of the G mutations (85.8%) from A to T, as depicted in (D). Thus, the relative rate of G-to-A intrinsic mutations is low. Cancer frequency data were obtained from [38].
Bottom Half: Kinetic models of circumstances resulting in mutation frequencies in VH5 during SHM. (E) Low background frequencies of about 10-9 mutations/base/generation resulting in C-to-T intrinsic mutations. (F) The consequences of the ~10,000-fold increase in transcription frequency in response to antigen challenge targeted primarily at Cs to T in ssDNA. (G) Predicted events occurring at the peak of Phase 1 of SHM as the result of AID activation and a switch from high frequency C-to-T mutations to high frequency C-to-U mutations, leading to enzyme diversification.

