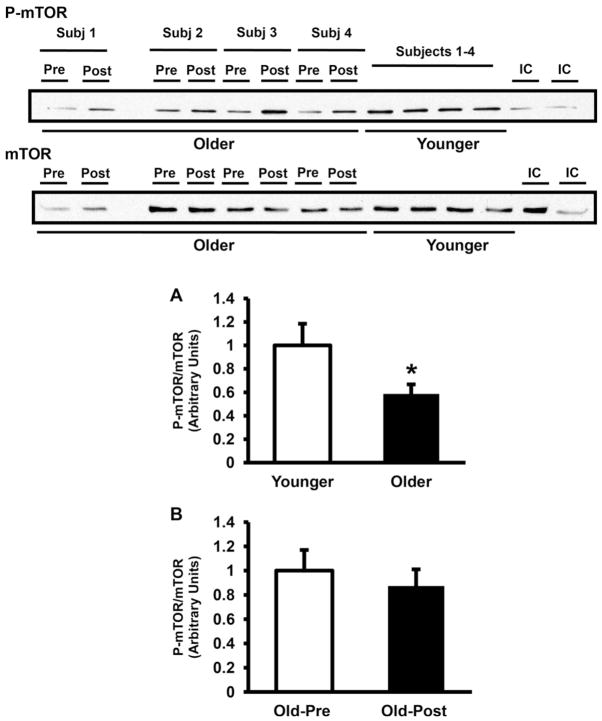
Fig. 5.
mTOR phosphorylation. mTOR phosphorylation and protein content were measured in older versus younger subjects at baseline (A) and in older pre- versus post-training (B). Data are means ± SE. n = 32/group in (A) and n = 25/group in (B). *P < 0.05 older versus younger group. Representative blots are shown for 4 younger and 4 older subjects. IC, internal control.

