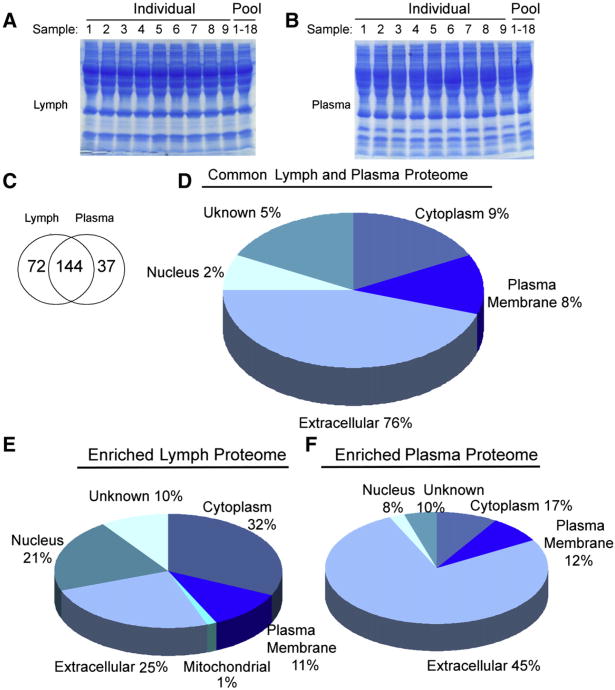
Fig. 2.
Analysis of the human lymph and plasma proteomes using 1DE SDS–PAGE coupled with nanoLC tandem MS/MS. A) Coomassie stained 4–15% SDS–PAGE of human lymph (9 individual patients and pooled sample from 18 patients) and B) human plasma (9 individual patients and pooled sample from 18 patients) (70 μg of total protein were run in each lane). Sixteen gel bands were excised from each lane; proteins were tryptic-digested and analyzed by nanoLC–ESI–MS/MS analysis. C) Venn diagram analysis of the proteomics profiles derived from 18 pooled lymph and matched plasma samples and from the combined analysis of 9 individual lymph and plasma samples (the non-redundant list of all proteins found in the lymph and plasma is shown in Table 2). D, E, F) Pie charts displaying the subcellular distribution of the D) lymph and plasma common proteome displayed in the Venn diagram (144 shared proteins). Numbers are calculated as percentage of the common 144 proteins (Table 2). Cellular distribution of the enriched proteomes found in the E) lymph and in the F) plasma (72 and 37 enriched proteins in the lymph and plasma respectively). Numbers are calculated as percentage of each enriched proteome. The proteins associated with the common 144 and the enriched proteins are shown in Table 2 (unknowns are included in the % distribution).

