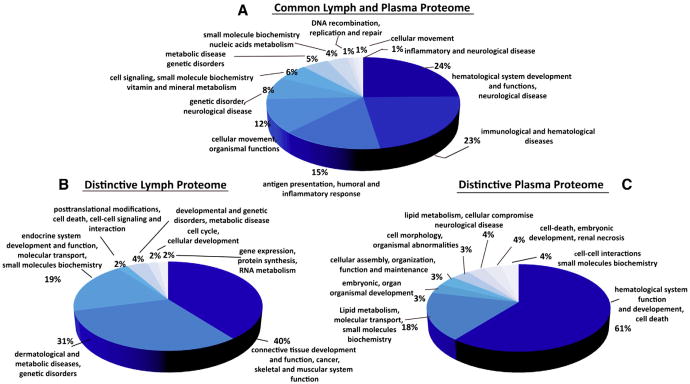
Fig. 3.
Functional networks analysis of the human lymph and plasma common and enriched proteomes. A) Pie chart of the human lymph and plasma major common functional networks. Data were generated using the IPA (ingenuity pathway analysis) software. The graphic display is generated from the common 144 proteins shown in Table 2. B) Pie chart of the human major lymph networks derived from the enriched lymph proteome is shown in Fig. 2C (72 proteins) and Table 2. C) Pie chart of the human major plasma functional networks derived from the enriched plasma proteome shown in Fig. 2C (32 proteins) and Table 2.

