Fig. 2.
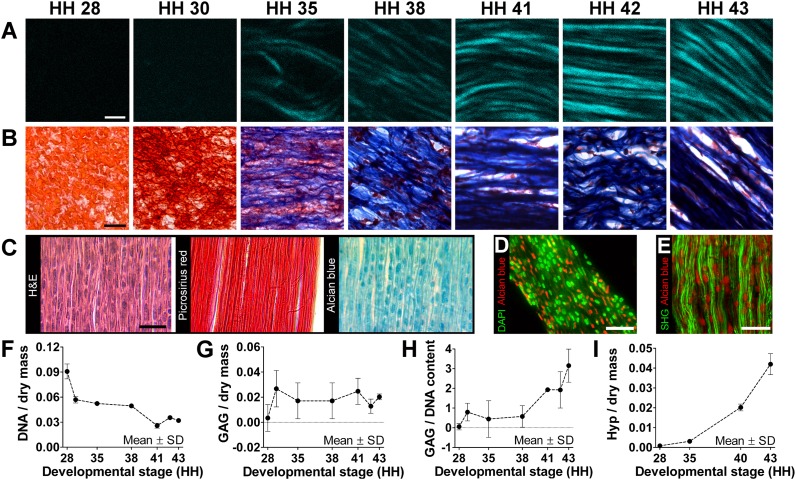
Morphological and biochemical characterization. (A) SHG imaging showed increases in collagen density and organization during tendon development. (Scale bar, 2 μm.) (B) Trichrome staining showed a decrease in cellularity (red) and increase in collagen content (blue) with development. (Scale bar, 20 μm.) (C) HH 43 tendon sections show high density of cell nuclei (H&E), aligned collagen (Picrosirius red), and GAG deposits (Alcian blue). (Scale bar, 25 μm.) (D) Cell nuclei (green) and GAG deposits (red) were similar in shape and size but spatially distinct in HH 43 tendon. (Scale bar, 25 μm.) (E) GAG deposits (red) appeared closely associated with collagen fibers (green). (Scale bar, 20 μm.) From HH 28–43, DNA-to-dry mass content decreased by 67% (F; n = 3); GAG-to-dry mass content remained relatively constant (G; n = 3); and GAG-to-DNA ratio (H; n = 3) and Hyp-to-dry mass ratio (I; n = 3), representative of collagen content, increased dramatically.

