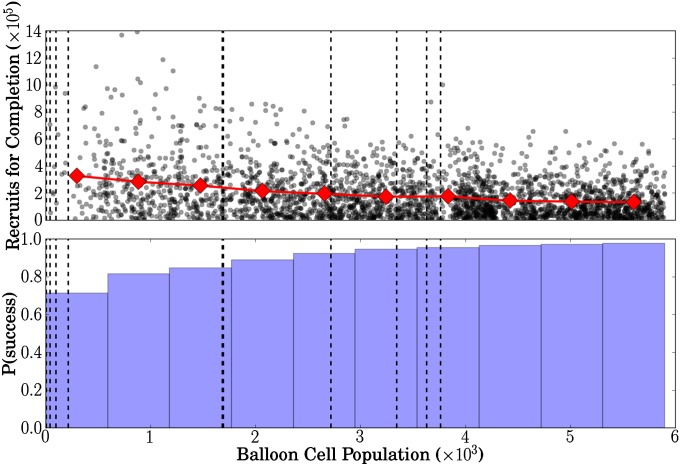
Fig. 2.
Scatter plot of the number of recruits at completion in a search for a single randomly placed balloon as a function of the population in the cell in which the balloon is placed for 5,000 randomly selected balloon locations. Black dots represent only successful searches (Upper). The histogram represents the probability of successfully finding the balloon. Dashed black vertical lines indicate the populations of the locations used in the DARPA Balloon Challenge. The red line represents the mean number of recruits for each histogram bin (Lower).

