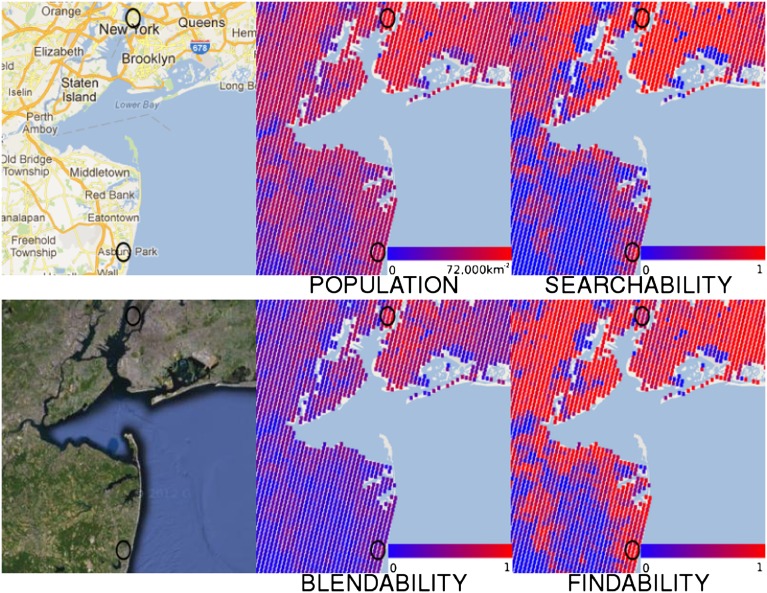
Fig. 4.
Maps of Manhattan and Asbury Park showing variation in population density, searchability, blendability, and findability, as well as underlying satellite and road maps. Black circles indicate locations of Manhattan, NY (Upper), and Asbury Park, NJ (Lower). Population density is on a logarithmic scale; all others are on a linear scale. Unpopulated cells are not shown.

