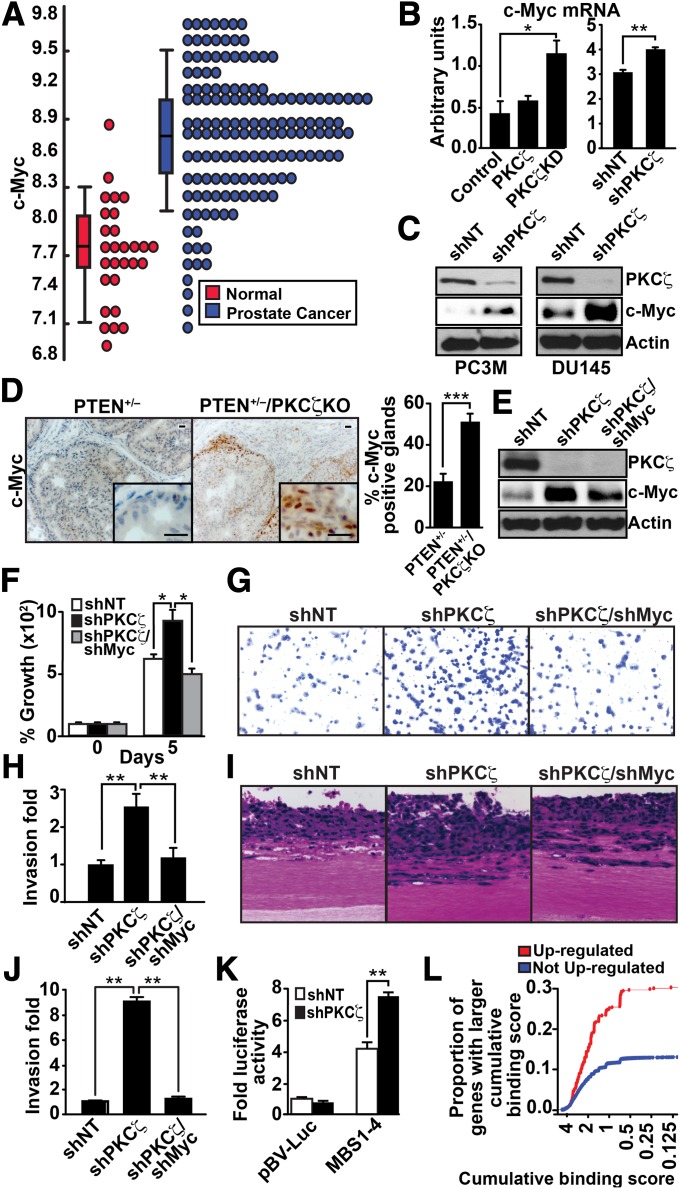
Fig. 4.
PKCζ regulates c-Myc levels. (A) Dot plot view of the distributions of c-Myc expression data in normal and PCa samples. (B) Quantification by Q-PCR of c-Myc mRNA levels in control, PKCζ, and PKCζ-KD P2 cells (Left), and in shNT and shPKCζ DU145 cells (Right). Results are shown as mean ± SEM; n = 3. *P < 0.05; **P < 0.01. (C) Immunoblot analysis of c-Myc and PKCζ levels in shNT- and shPKCζ-expressing PC3M and DU145 cells. (D) Immunostaining of c-Myc in prostate sections and quantification of staining (Right). Results are the mean ± SEM (n = 5 mice; ***P < 0.001). (Scale bar, 20 μm.) (E) Immunoblotting for c-Myc, PKCζ, and actin levels of DU145 cells infected with the indicated shRNA lentiviral vectors. (F) Cell proliferation was determined by trypan blue exclusion assay in DU145 cells infected with the indicated lentiviral knockdown vectors. Values are mean ± SEM of triplicate counts of three different experiments. *P < 0.05. (G–J) Invasion by the modified Boyden chamber assay (G and H) or by organotypic cultures (I and J) for DU145 cells infected with the indicated shRNA lentiviral vectors. Results are shown as mean ± SD n = 3. **P < 0.01. (K) shNT or shPKCζ DU145 cells were transfected with c-Myc–luciferase reporters. Luciferase activity was normalized to Renilla activity. Values are mean ± SEM of triplicate counts of two different experiments. **P < 0.01. (L) Comparisons of the distributions of Myc cumulative binding scores for the 519 genes up-regulated (FDR < 0.05) in PKCζ-KD samples (red) and the remaining 20,693 genes (blue). The proportion of up-regulated genes with high cumulative binding score (CBS) is significantly higher (Kolmogorov–Smirnov test P value = 4.3 × 10⁻¹³) than the proportion of genes with high CBS that were not up-regulated.

