Fig. 1.

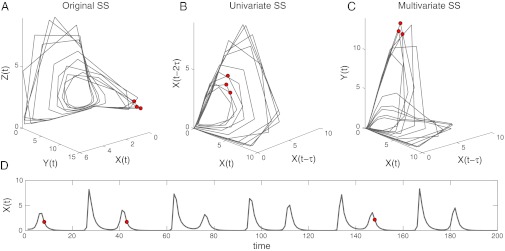
State space reconstruction demonstrated with a three-species logistic model. (A) The trajectory of the model ecosystem is plotted in three dimensions using the abundances X(t), Y(t), and Z(t) as coordinates. (B) The trajectory is shown in the univariate SSR coordinates, [X(t), X(t−1), X(t−2)], where lags of X take the place of the other variables. (C) The trajectory is shown in multivariate SSR coordinates, [X(t), X(t−1), Y(t)]. The system is in a similar state (nearby in state space) at times t1, t2, and t3 (red) based on all three representations. Hence, any of these state spaces (original or reconstructed) can be used for nearest-neighbor forecasting. (D) The abundance of species X is shown as a time series.
