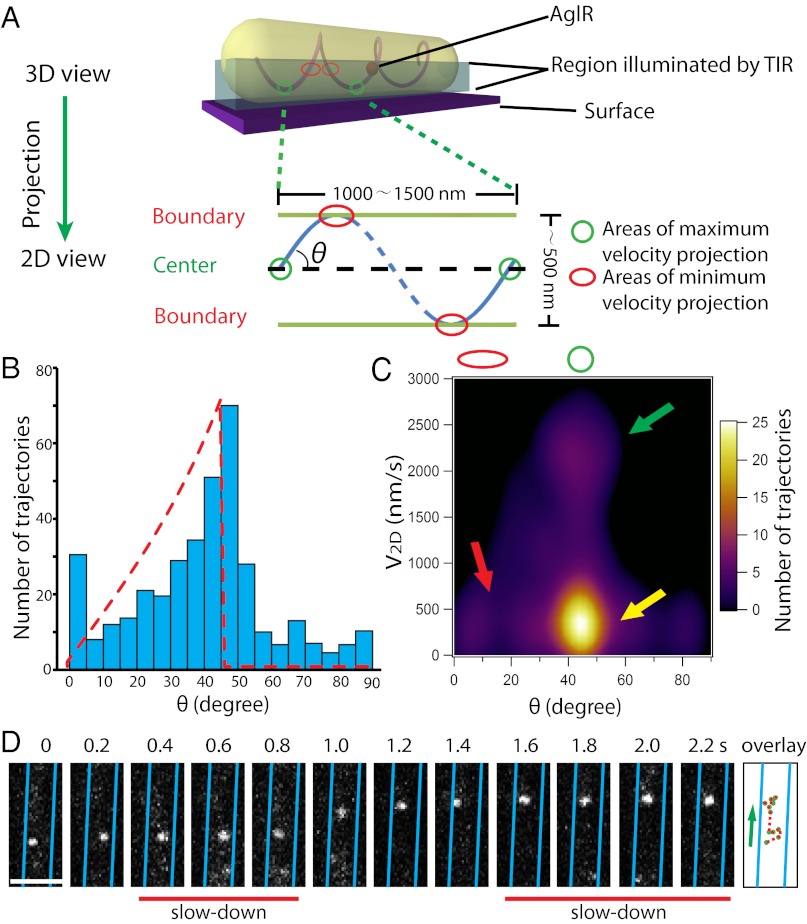
Fig. 4.
AglR moves in helical trajectories. (A) A mathematical model in which the 3D movement of AglR molecules is projected into 2D images. V2D-max and V2D-min are expected near the cell center (green circle) and the cell boundaries (red circle), respectively. (B) Distribution of the angles (θ) between AglR trajectories in each 100-ms period and the long axis of cells. Red dotted line shows the predicted asymmetric angle distribution. The angle distribution was derived from 397 AglR trajectories in five cells. (C) V2D-max is detected near the cell center, where θ is 45–50° (green arrow). V2D-min appears near the cell boundaries where θ is low (red arrow). However, low V2D is also detected near the cell center (yellow arrow), indicating that AglR molecules slow down at surface contact sites. (D) Single AglR molecules slow down at the center of the projected cell surface. (Scale bar, 1 µm.) Only a section of cell is shown in this figure. Images of the whole cell are shown in Movie S12.

