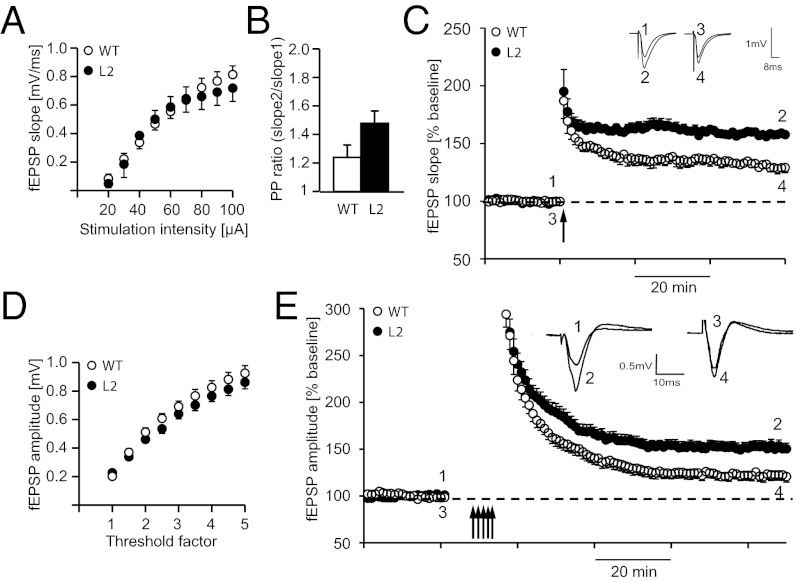
Fig. 5.
Hippocampal as well as cortical LTP are increased in Nogo-A knockdown rats. (A) Input–output relationships (I/O curves) from WT (n = 6) and L2 Nogo-A knockdown rats (n = 6) recorded in the hippocampal CA3-CA1 Schaffer collateral pathway. I/O curves indicate no significant difference in synaptic strength across stimulation intensities. (B) Paired pulsed ratio measured at different interstimulus intervals did not significantly differ between WT and L2 (n = 6 each). (C) LTP was induced by TBS (arrow) in L2 and WT rats. At 60 min after TBS, a significant difference between L2 and WT rats could be observed. Inset shows original traces from representative individual experiments; numbers correspond to the time point when traces were taken. (D) I/O curves from WT (n = 15) and L2 Nogo-A knockdown rats (n = 15) recorded in layer II/III horizontal connections in the M1 forelimb area of brain slices. I/O curves indicate no significant difference in synaptic strength across stimulation intensities. (E) Maximum synaptic strength (LTP saturation) was determined by repeated induction of LTP (multiple arrows). Peak amplitudes were significantly larger in L2 (n = 16) compared with WT rats (n = 15). Each field potential trace represents an average of 10 individual responses at times indicated by numbers.

