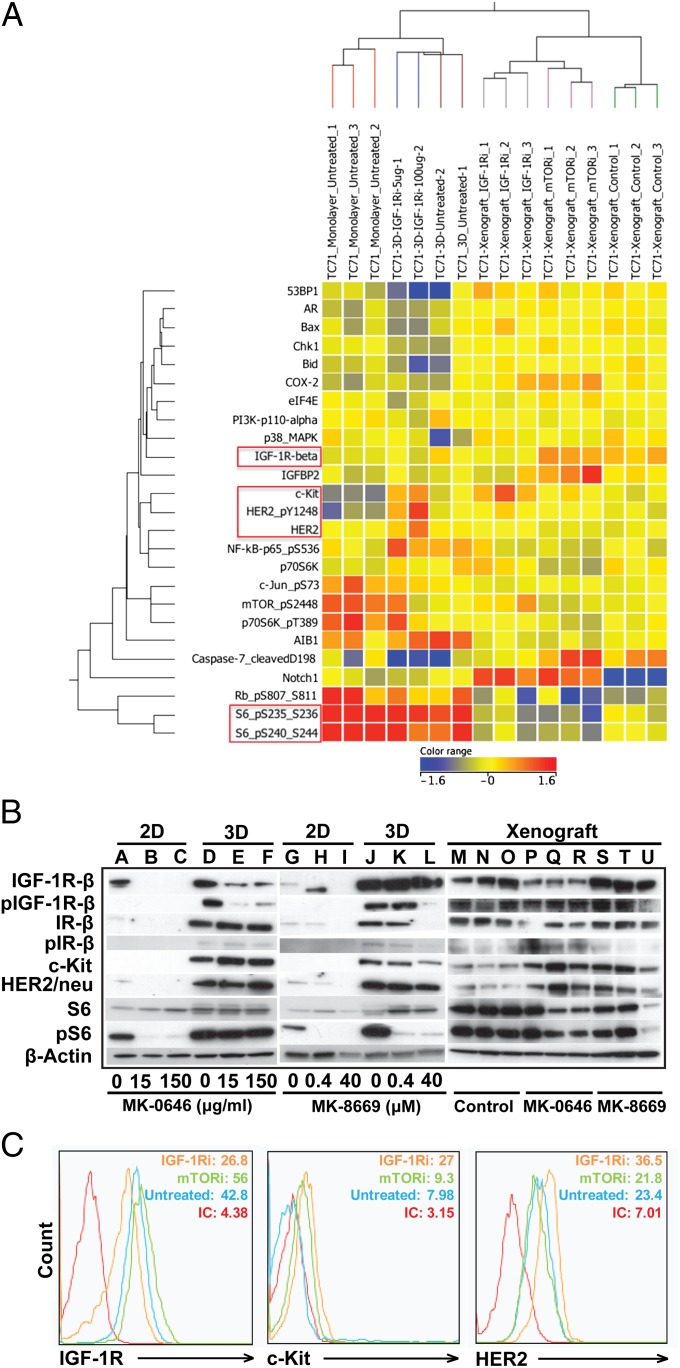
Fig. 5.
Response of TC-71 EWS cells to IGF-1R and mTOR inhibition. (A) Reverse-phase protein array (RPPA) analysis of selected proteins in the IGF-1R/mTOR pathway (red, increased signal; blue, decreased signal). Protein lysates were harvested from TC-71 cells in 3D PCL scaffolds, in 2D monolayer culture, or in vivo. RPPA findings were validated using (B) Western blot and (C) flow-cytometric analysis. Similar alterations in the expression of IGF-1R, c-kit, and HER2/neu were observed in cells in the 3D PCL scaffolds and in vivo xenografts.

