
Fig. 3.
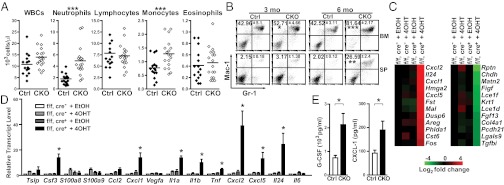
Enhanced neutrophil-dominated inflammatory reactions in CKO mice. (A) The numbers of leukocytes measured with an automated hematology analyzer in Ctrl and CKO mice at 6 mo after 4OHT injection. The mean number of each cell type is indicated by a horizontal line (Ctrl, n = 15; CKO, n = 18). (B) Flow cytometry analysis of the frequencies of Gr-1+Mac-1+ cells in BM cells and splenocytes (SP) of Ctrl and CKO mice. The numbers shown represent the percentage of Gr-1+Mac-1+ neutrophils in each upper-right quadrant. (C) Heat map of microarray analysis using indicated keratinocytes cultured with 4OHT or EtOH. Data were normalized to Prdm1f/f (f/f), K5-CreER(Cre)− + EtOH group, and the 12 genes with the greatest changes are shown. (D) RNA from keratinocytes cultured as described in C was used for qRT-PCR analysis of cytokine/chemokine gene expression. (E) The Luminex assay was used to detect the increased levels of G-CSF and CXCL-1 in serum of CKO mice at 6 mo after 4OHT injection. Results are mean ± SEM (n = 3, 4, and 6 in B, D, and E, respectively). *P < 0.05; **P < 0.01; ***P < 0.005.