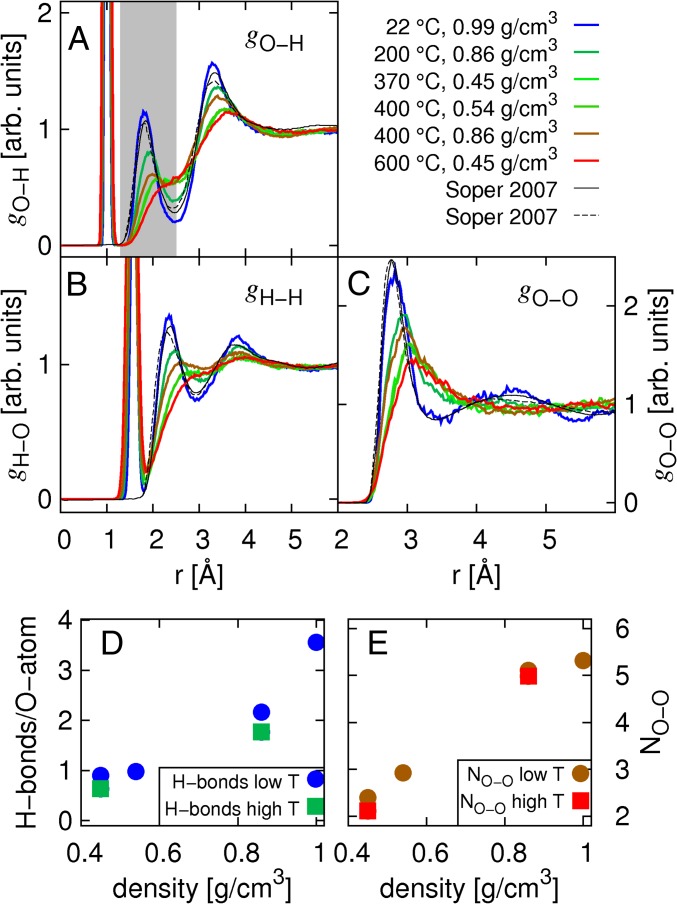
Fig. 3.
(Upper, A–C) O-H, H-H, and O-O PCFs, respectively, as derived from the MD trajectories and in comparison to the two experimental results from a study by Soper (45). (Lower, D and E) Number of H-bonds per molecule and number of nearest neighbors as a function of density extracted from the MD simulation snapshots. (Lower) Term “high T” refers to values determined for equal density but higher temperature conditions, as indicated in the other part of the figure (Upper). arb., arbitrary.

