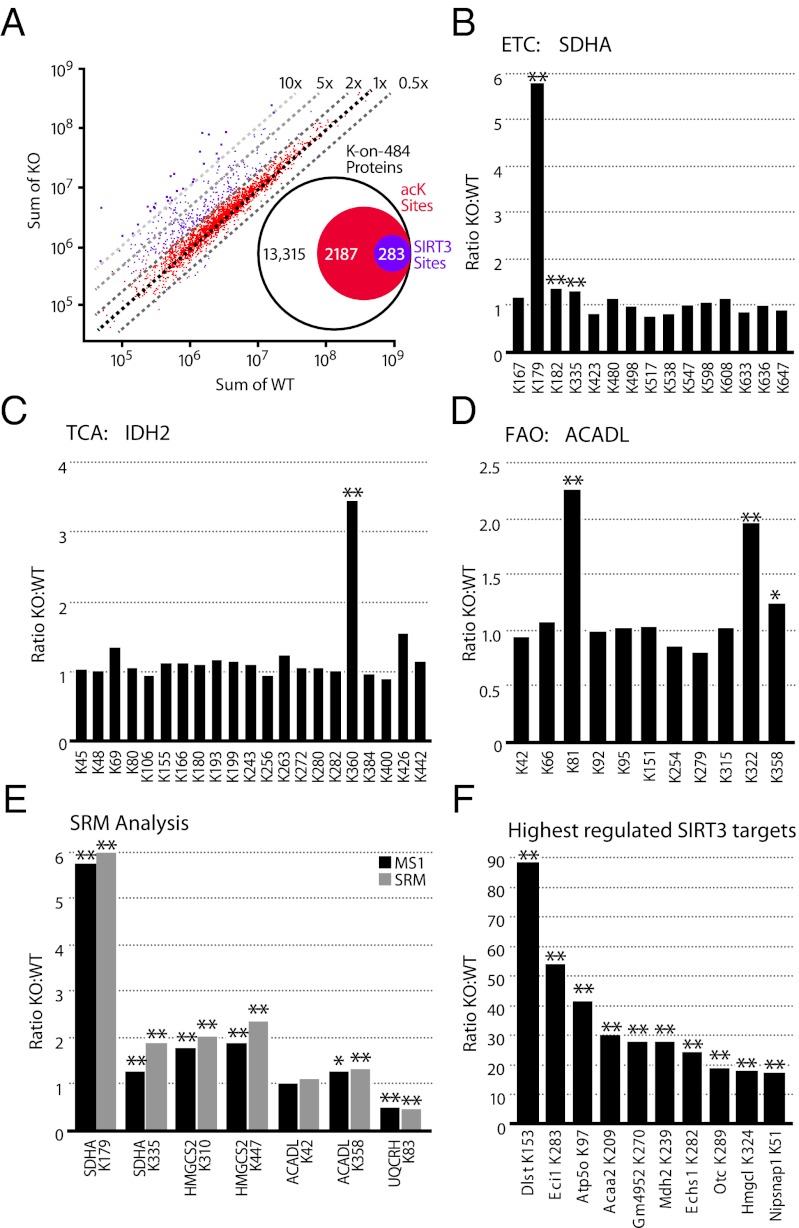
Fig. 3.
Identification of SIRT3 substrates by label-free quantitation. (A) Scatter plot of the acK peptides quantitated by MS1 Filtering after normalization. Dashed lines indicate the fold change in intensity between WT and KO. Peptides with a significant (P ≤ 0.01) at least twofold change are indicated in purple; all other peptides are in red. Inset summarizes the number of acK sites significantly changed in SIRT3−/− liver mitochondria from the total number of acK sites identified. Acetylation profiles of (B) succinate dehydrogenase subunit A (SDHA) from complex II in the ETC, (C) isocitrate dehydrogenase (IDH2) in the TCA cycle, and (D) long-chain specific acyl-CoA dehydrogenase (ACADL) in the fatty acid oxidation pathway. (E) Relative quantitation measurements resulting from SRM analysis of targeted acK sites using stable isotope dilution with synthetic peptide standards to the indicated proteins/acK sites. The most intense fragment ion was used for analysis and compared with MS1 Filtering results. (F) Largest fold changes (KO:WT) for individual acK sites. From left to right, dihydrolipoyllysine succinyltransferase (DLST), enoyl-CoA isomerase (ECI1), ATP synthase subunit O (ATP5O), 3-ketoacyl-CoA thiolase (ACAA2), Glycine N-acyltransferase-like protein (GM4952), malate dehydrogenase (MDH2), enoyl-CoA hydratase (ECHS1), ornithine carbamoyltransferase (OTC), hydroxymethylglutaryl-CoA lyase (HMGCL), and NipSnap homolog 1 (NIPSNAP1). Two-tailed Student t test (*P ≤ 0.05, **P ≤ 0.01); n = 5 for WT and KO with two injection replicates per sample.

