Fig. 1.
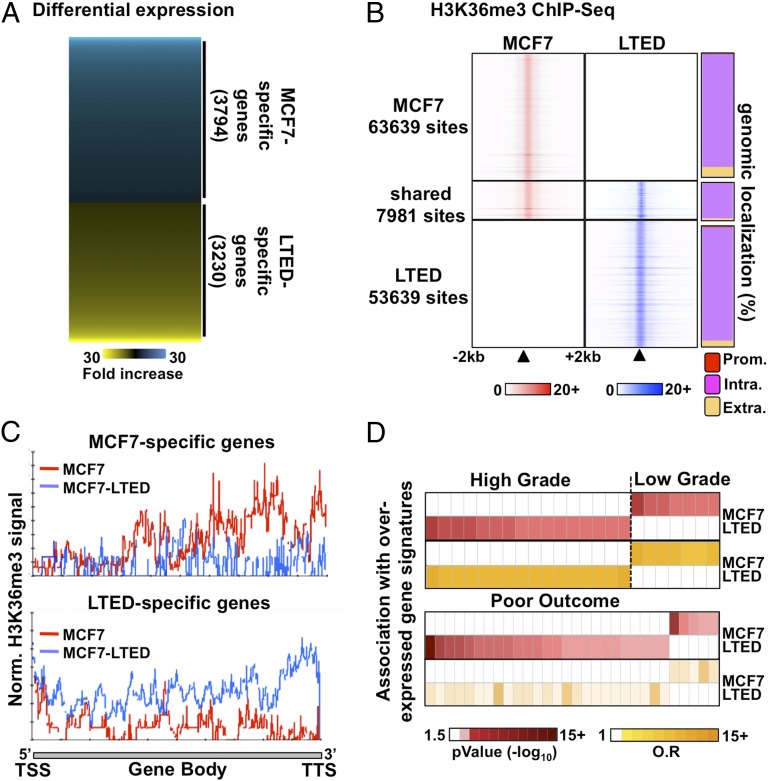
Distinct transcriptional programs typify ET response. (A) Microarray-based expression profiling in ET-resistant LTED and -responsive MCF7 breast cancer cells reveals distinct transcriptional profiles. (B) MNase–ChIP-seq profiling of H3K36me3 in LTED (blue) and MCF7 (red) cells over a 4-kb window around called peaks (Left). The proportion (%) of H3K36me3 sites mapping to promoters (prom), intragenic (intra), or extragenic (extra) regions are presented for the unique or shared sites between MCF7 and LTED cells (Right). (C) ChIP-seq enrichment for H3K36me3 from either MCF7 (red line) or LTED (blue line) cells across genes specifically expressed in MCF7 (Upper) or LTED (Lower) cells based on the microarray expression profile. (D) Oncomine Concepts Map analysis comparing genes overexpressed in LTED (>twofold ratio vs. MCF7) or in MCF7 (>twofold ratio vs. LTED) cells and expression signatures from high-grade, low-grade, or poor-outcome breast tumors are presented.

