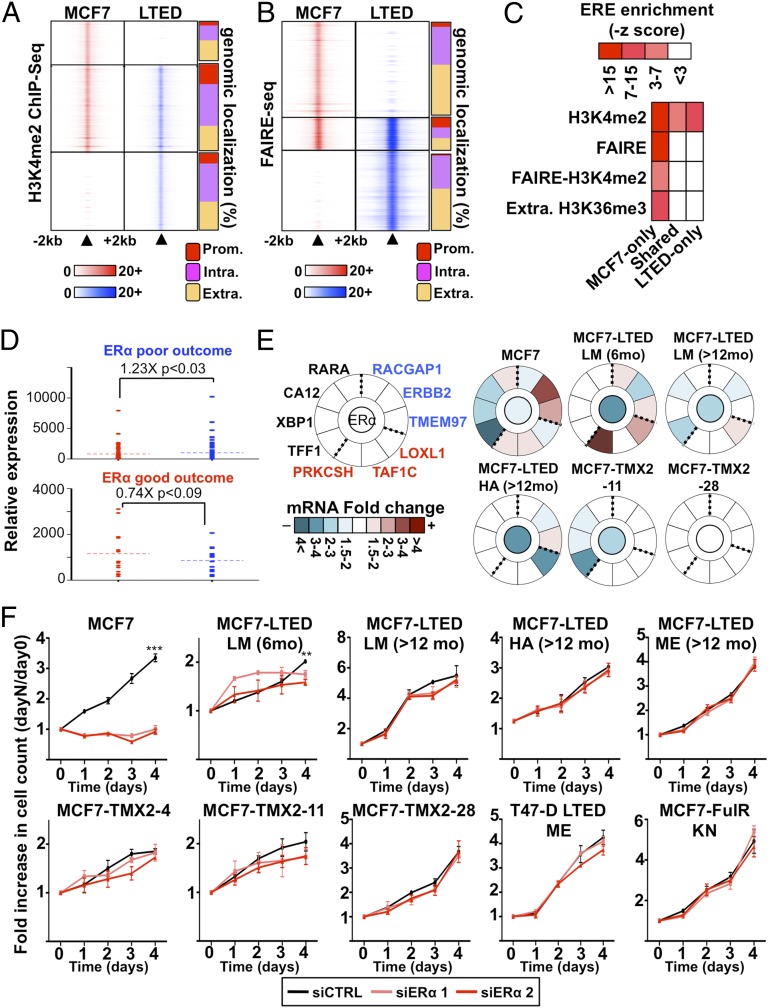
Fig. 2.
ERα-dependent signaling is reduced in ET-resistant breast cancer cells. (A) MNase–ChIP-seq against H3K4me2 in MCF7 and LTED cells. Results are presented as in Fig. 1B. (B) Genome-wide analysis of open chromatin regions (FAIRE-seq) from MCF7 and LTED are presented as in Fig. 1B. (C) Enrichment of the ERE within epigenetically defined regions (H3K4me2, FAIRE, and H3K36me3) from LTED and MCF7 cells. (D) Expression level based on microarray analysis in LTED (blue) and MCF7 (red) cells of genes discriminating ET response based on ERα-binding profiles in good-outcome (responsive) and poor-outcome (resistant) primary breast tumors. (E) Transcriptional analysis of a selected list of genes discriminating good- and poor-outcome breast tumors (55) in response to ERα silencing in MCF7 or ET-resistant breast cancer cell line models. Expression is presented as mRNA fold change comparing siERα to control (siCTRL). The central circle indicates ERα-silencing efficiency. (F) Growth assays using two different siRNA targeting ERα are represented. Cell number is plotted as a ratio against day 0.

