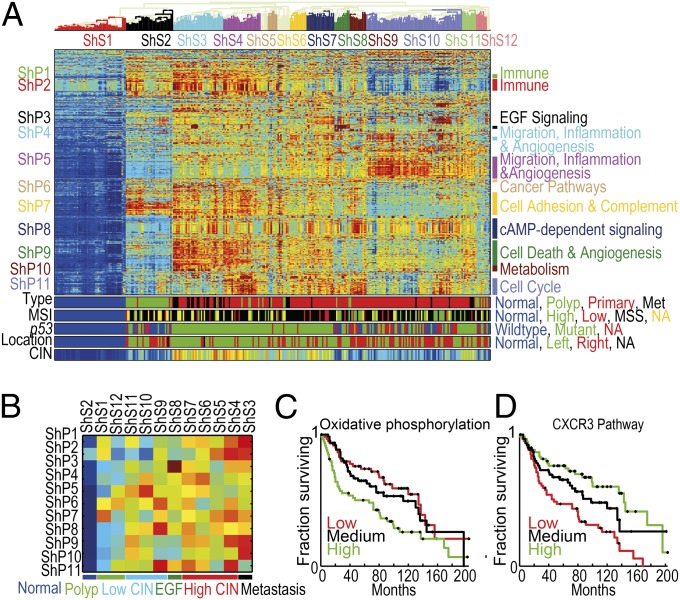
Fig. 4.
(A) Clustered normalized PDS of the Sheffer dataset. Pathways and samples are clustered according to PDS. For most pathways the PDS of the normal samples are minimal (dark blue), and hence the higher the PDS are the more deregulated the pathway is. For a few pathways (mostly in ShP2) tumors deviate from normals in both directions; PDSs of normal samples have PDS ∼ 0 (green); both highly positive PDS (dark red) and highly negative PDS (dark blue) correspond to pathway deregulation, but in different directions. The color bars at the bottom correspond to the sample type (met denotes metastasis), the MSI status [normal, low, high, MSS, and not available (NA)], p53 mutation status, anatomic location of the tumor, and the CIN index (equally distributed into 20 bins). (B) Summary of clustered pathway scores for the Sheffer dataset. Each row corresponds to a pathway cluster and each column to a sample cluster, displaying the median value of deregulation for each pair of clusters. The color bar indicates the major groups of samples. (C) Oxidative phosphorylation pathway is associated with survival. Kaplan–Meier plots for groups defined by the deregulation scores of oxidative phosphorylation in the Sheffer dataset. The primary tumor samples were divided into three equal groups, based on their level of deregulation (high, medium, and low). Low deregulation scores are associated with better prognosis. (D) CXCR3 pathway is associated with survival. Kaplan–Meier plots for the deregulation scores of CXCR3 pathway in the Sheffer dataset. The primary tumor samples were divided into three equal groups, based on their level of deregulation (high, medium, and low). High deregulation scores are associated with better prognosis.

