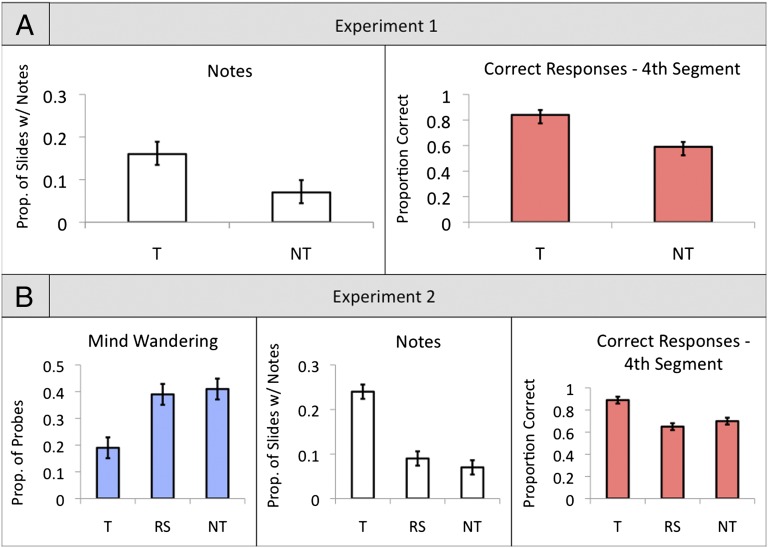
Fig. 2.
(A) Experiment 1. Proportion of slides for which students made additional notes during the 21-min lecture (Left), and mean number of questions answered correctly about the fourth lecture segment (Right); NT, nontested group; T, tested group. (B) Experiment 2. Proportion of mind wandering probes during which students reported having engaged in mind wandering away from lecture content (Left), proportion of slides for which students made additional notes during the 21-min lecture (Center), and mean number of questions answered correctly about the fourth lecture segment (Right); NT, nontested group; RS, restudy group; T, tested group. Error bars represent SEMs.

