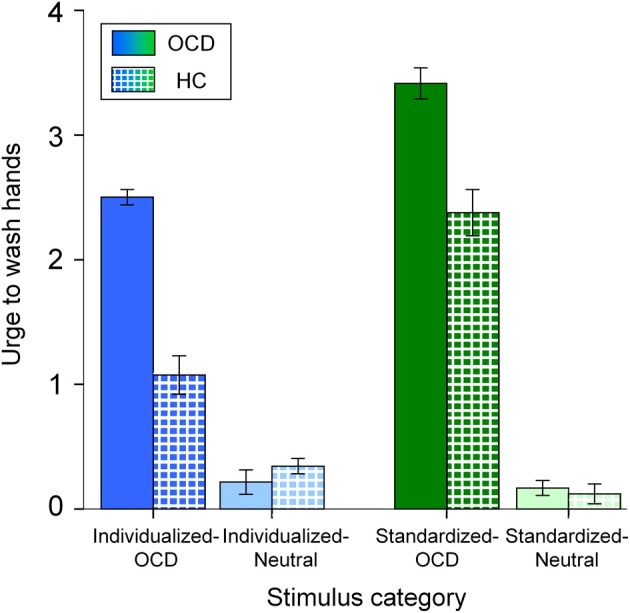
Figure 2.

Mean urge to wash hands (and standard errors of the mean) of patients (OCD; solid colors) and healthy controls (HC; patterned) for all stimulus categories. Note that the different colors depict the stimulus categories (dark blue: Individualized-OCD; light blue: Individualized-Neutral; dark green: Standardized-OCD; light green: Standardized-Neutral; also cp. Figure 1).
