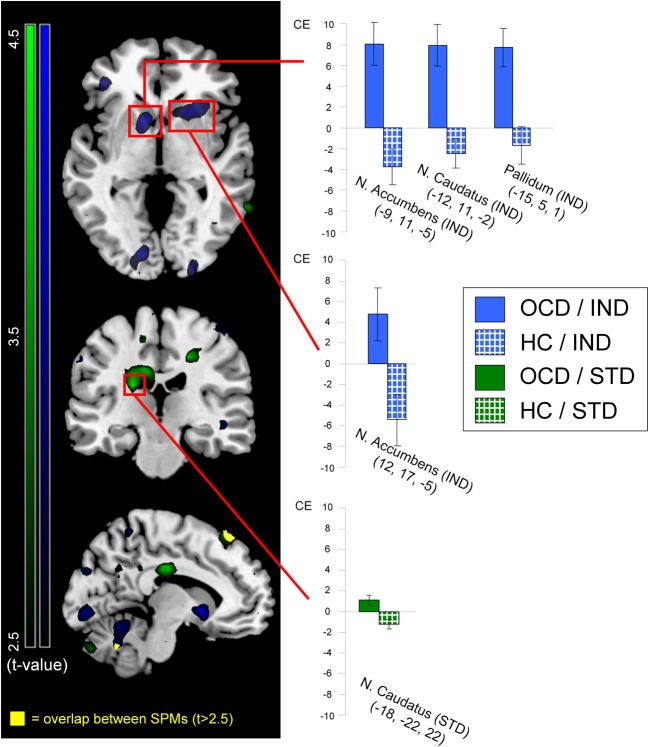
Figure 3.
Neural activation of patients (OCD; solid colors) greater than healthy controls (HC; patterned) contrasted for individualized (IND; blue) and standardized (STD; green) symptom provocation. The figure displays statistical parametrical maps with whole-brain t-values for the between-group contrasts (OCD > HC) for both symptom provocation approaches. For illustration reasons, data were thresholded with t > 2.5 (see color bars for exact t-values) and displayed on a standard MNI brain template. Significant results from the voxel-wise ROI analyses are marked with red rectangles. Additionally, all significant between-group results are further depicted using the peak voxels of the OCD group: the bar graphs illustrate mean contrast estimates (CE) of the symptom provocation contrasts (with the corresponding standard errors of the mean) for patients (gray) and healthy controls (white). All coordinates are given in MNI space. The lower slice (x = −10; left hemisphere) depicts the only regions with an overlap (yellow) between both whole-brain statistical parametrical maps, with a threshold of t > 2.5; these regions were not included in any ROI and are depicted for illustrative purposes only.

