
Figure 4.
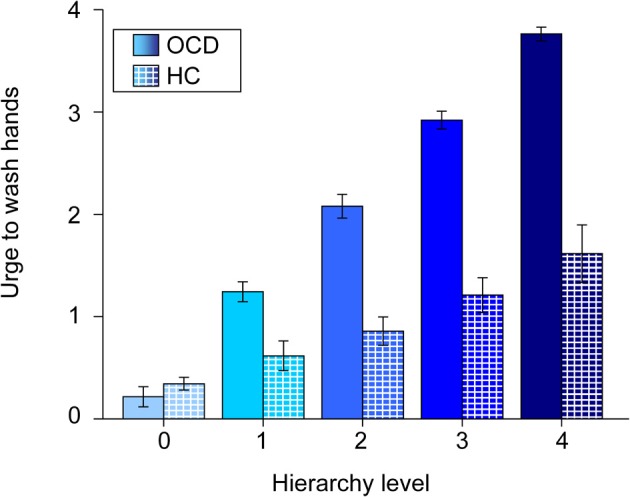
Mean urge to wash hands (and standard errors of the mean) of patients (solid colors) and healthy controls (patterned) for individualized pictures plotted against hierarchy levels. Note that values of healthy controls are plotted against the original hierarchy level values of their respective matching partners. The different shades of blue represent the different original hierarchy level values (cp. Figure 1).