
Fig. 1.
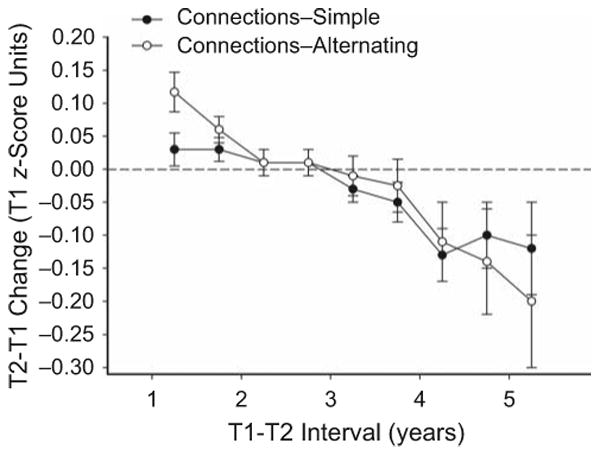
Mean change, with standard errors, for the two Connections variables as a function of test-retest (T1-T2) interval. Successive data points are based on partially overlapping samples; each sample has a T1-T2 range of 1.5 years, and the ranges of successive samples begin 0.5 years apart.