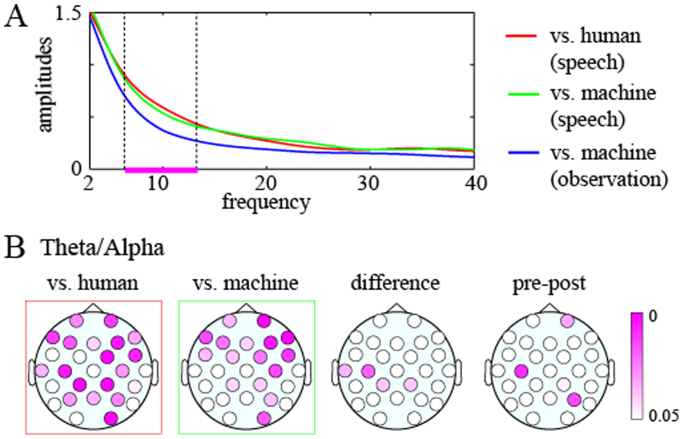
Figure 4. Frequency amplitudes and associated analyses.
(A) Subject-, time-, and channel-averaged frequency amplitudes of subjects who participate in human–human (red) or human–machine (green) alternating speech tasks or subjects who observe their partner participating in the speech task with the machine (blue). (B) Topographic colored scalp maps of the P values of the theta/alpha (6–12 Hz) amplitudes of the differences between the tasks and the inter-trial interval (ITI) of human–human and human–machine tasks and of differences between the human–human and human–machine tasks (left and central). Scalp maps of the P values of the theta/alpha amplitudes for the differences between pre- and post-machine human–human tasks (right).

