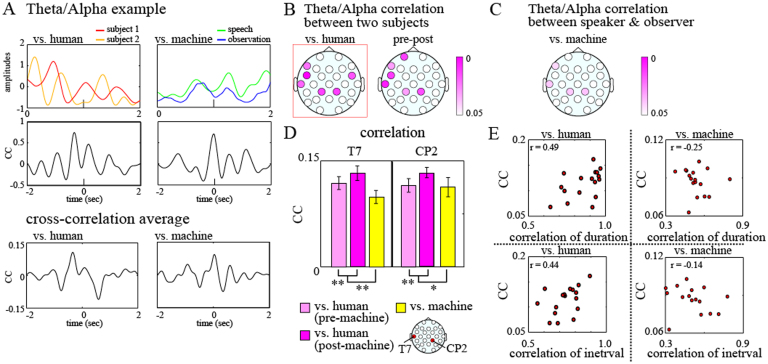
Figure 5.
(A) Examples of theta/alpha amplitudes on the temporal electrodes (T7) of two subjects and their time-course cross-correlation coefficients during the human–human and human–machine tasks (top and middle).Examples of averaged cross-correlation coefficients for human–human and human–machine tasks (bottom). (B) Scalp maps of the P values, which show significant correlations between the two subjects' theta/alpha amplitudes during the human–human tasks (left) and differences between the correlation coefficients in the pre- and post-machine human–human tasks (right). (C) Scalp maps of the P values, which show significant correlations between the two subjects' theta/alpha amplitudes during the human–machine tasks. (D) Subject-averaged correlation coefficients on the temporal (T7) and lateral parietal (CP2) electrodes during the human–human and human–machine tasks. (E) Scatter plots between the inter-brain correlation coefficients on the temporal (T7) electrodes and the correlation coefficients of the duration and interval of the speech rhythms between the subjects.

