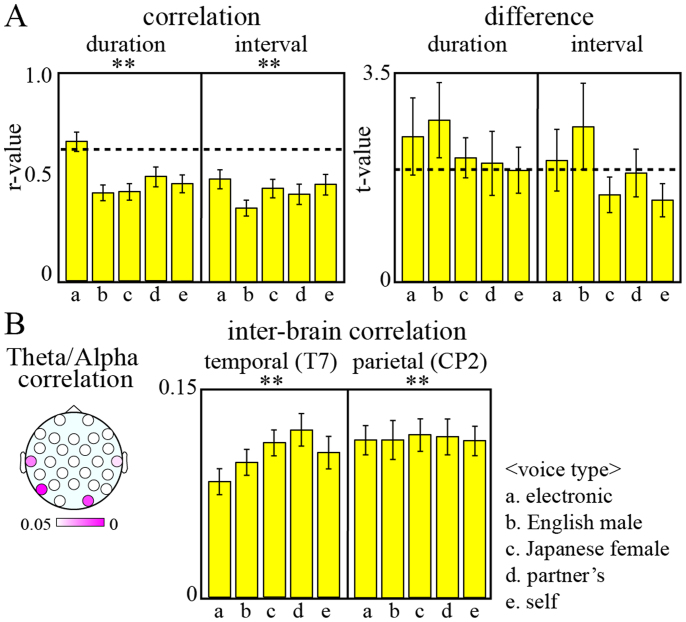
Figure 6. Analyses of the speech rhythms among the voice types.
(A) Subject-averaged correlations and differences in the durations of the voices and intervals between the voices during the human–machine tasks; five voices were used [electronic (a), male (b), female (c), partner's (d) and subject's (e) voices]. (B) Scalp maps of the P values, which show significant main effects of the voices for correlations between the two subjects' theta/alpha amplitudes under machine conditions (left). Subject-averaged correlation coefficients on the temporal (T7) and lateral parietal (CP2) electrodes for each machine voice.

