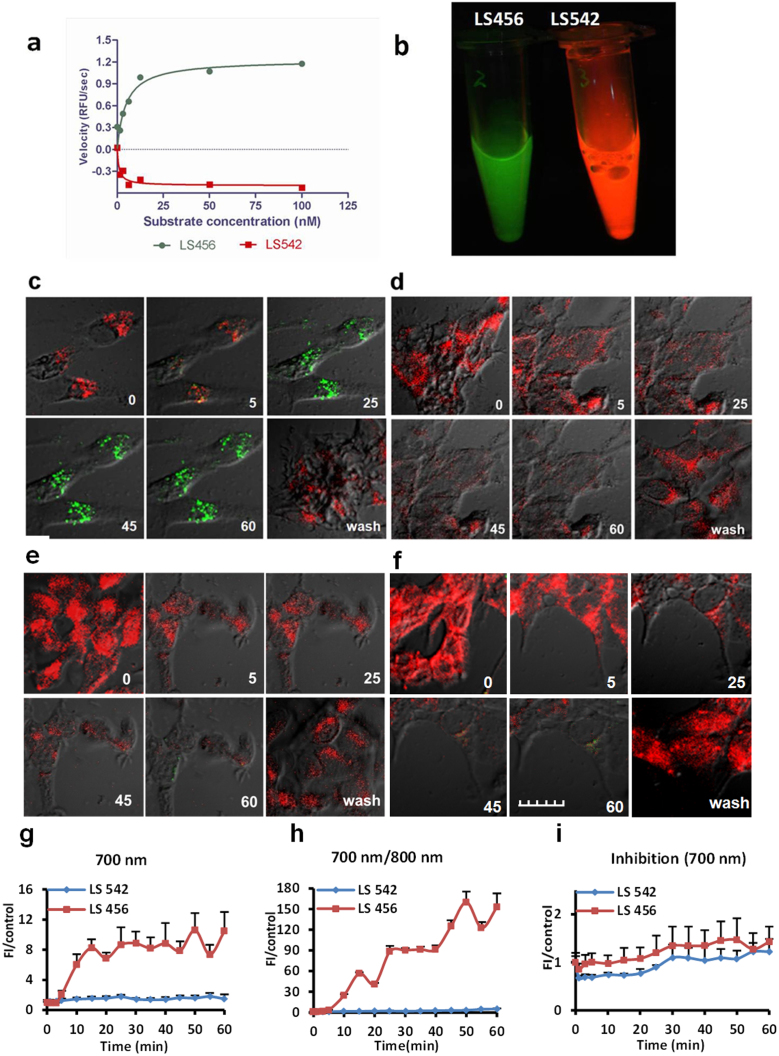
Figure 2. Selective phosphorylation of LS456 over LS542 by insulin-activated Akt in MCF-7 cells.
(a) In vitro enzyme assay demonstrating the rate of fluorescence increase in the 700-nm channel (green) for LS456, suggesting mono-phosphorylation of the probe. The control compound LS542 had negligible fluorescence changes in both the 700-nm and 800-nm (red, shown) channels. (b) Cell lysate of LS456 and LS542 using monoclonal anti-phosphorylated Akt473 in MCF7 cells after insulin treatment for 20 min. Excitation at 650 and 785 nm and imaging in both the 700-nm and 800-nm channels show that only LS456 transformed from 800-nm (red) to 700-nm (green) emission, indicating that Akt phosphorylated LS456 but not LS542. (c–f) Real-time NIR fluorescence confocal microscopy of the molecular probe and control compound. The time-dependent transition of LS456 from red to green suggests rapid phosphorylation of the enzyme substrate. The replacement of the insulin solution with non-insulin culture medium demonstrates the reversibility of the process (c). This spectral transition was successfully inhibited with the PI3K inhibitor, wortmannin, in the presence of insulin (d). Similar experiments with LS542 with insulin stimulation (e) and in the presence of wortmannin (f) did not generate any increase in the 700-nm channel. All microscopy studies were conducted at 30°C. (g–i) Quantitative analysis of the images of panel (c–f). The fluorescence of LS456 at the 700 emission channel increased 10-fold at 50 min after insulin administration (g). The 700/800-nm fluorescence enhancement ratio of LS456 by insulin stimulation of Akt was > 150-fold at 50 min post-treatment (h), which was blocked with the PI3K inhibitor wortmannin (i). Red colors represents Ex/Em = 785 nm/805–830 nm. Green colors represents Ex/Em = 633 nm/670–730 nm. Fluorescence images in cells are superimposed on differential interference contrast images. Error bars are reported as mean ± standard deviation (N = 8).

