Fig. 2.

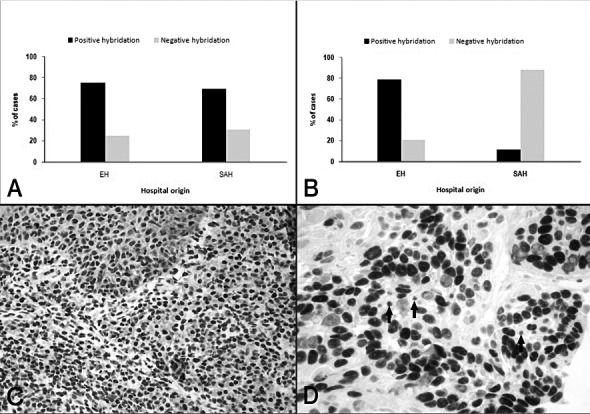
EBER identification by ISH: (A). Epithelial cells. (B) Lymphocytes. Data are expressed as mean percentage of positive-staining cells (%). (C) (20×). (D) (40×). Positive hybridization of epithelial cells and lymphocytes.

EBER identification by ISH: (A). Epithelial cells. (B) Lymphocytes. Data are expressed as mean percentage of positive-staining cells (%). (C) (20×). (D) (40×). Positive hybridization of epithelial cells and lymphocytes.