
Figure 1.
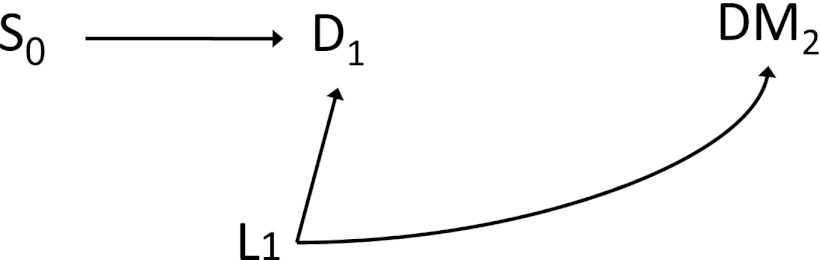
Simplified directed acyclic graph presenting the potential for differential survival. D1, death during follow-up (e.g., due to cardiovascular disease); DM2, diabetes mellitus by the end of follow-up; L1, a vector of common risk factors of diabetes and mortality such as age, obesity, and smoking; S0, statin therapy at baseline.