
Figure 1.
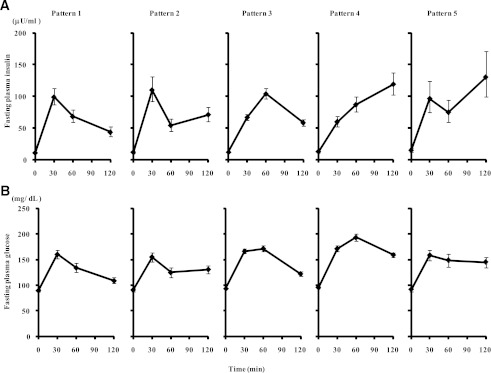
A: Insulin concentration patterns during an OGTT (geometric means [95% CI]): pattern 1, peak of insulin during an OGTT at 30 min and insulin levels at 60 min greater than those at 120 min; pattern 2, peak of insulin at 30 min and insulin levels at 60 min less or equal to those at 120 min; pattern 3, peak of insulin at 60 min; pattern 4, peak of insulin at 120 min and insulin levels at 30 min lower than those at 60 min; and pattern 5, peak of insulin at 120 min and insulin levels at 30 min greater or equal to those at 60 min. B: Plasma glucose pattern during an OGTT for each of these insulin patterns (means [95% CI]).