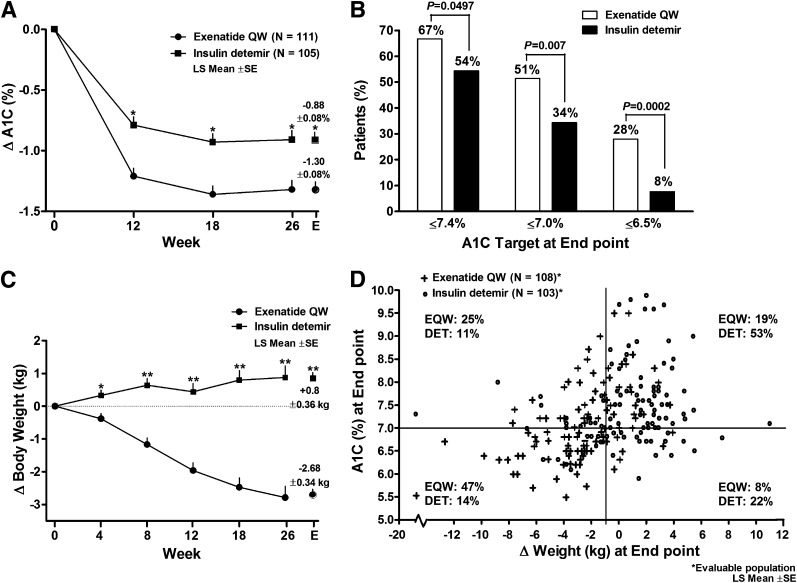
Figure 2.
Change in glycemic control and body weight at end point and at specific time points over 26 weeks of treatment with EQW or insulin detemir (ITT population). A: LS mean ± SE change in A1C at 12, 18, and 26 weeks (MMRM used for analysis; data include patients with available data) and at end point (ANCOVA and last observation carried forward method used for analysis of change from baseline to end point). P indicated for treatment differences. *P < 0.0001. B: Proportion of patients who achieved target A1C of ≤7.4%, ≤7.0%, and ≤6.5%. C: LS mean ± SE change in body weight at weeks 4 to 26 and at end point (statistical methods same as those used for change in A1C); P indicated for treatment differences. *P = 0.0008 and **P < 0.0001. D: Scatter plot of A1C compared with change in weight at end point.

