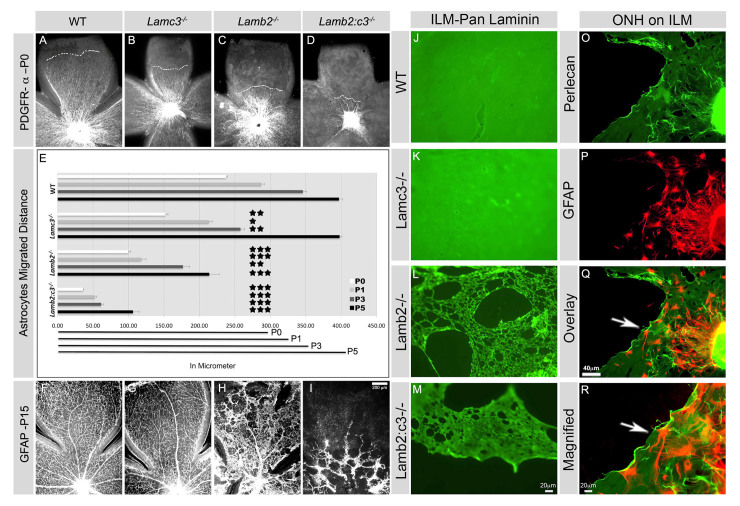
Fig. 2.
Astrocyte migration and spatial organization is laminin dependent. (A-D) PDGFRα+ astrocyte distribution was analyzed at P0 in retinal wholemounts. The broken white lines mark the boundaries of astrocyte migration in each genotype. (E) Distances covered by astrocytes from P0 to P5. Average distance covered by astrocytes per quadrant of indicated genotypes (all are n=3 except Lamb2-/- P5, n=2). Error bars represent s.e.m. ***P≤0.001; **P≤0.003; *P≤0.01. The horizontal black lines at the bottom of the chart represent the average length of retinal quadrants from P0 to P5. (F-I) GFAP+ astrocyte distribution was analyzed in P15 retinal wholemounts. (J-M) The structure of the ILMs from P15 animals (genotype indicated) was studied using a pan-laminin antibody. Wild type and Lamc3-/- are uniform in appearance (J,K), whereas Lamb2-/- (L) and Lamb2:c3-/- (M) are defective with numerous large holes. (N-P) Wild-type ILM was used as a substrate for astrocyte (GFAP, red) migration from ONH explants. Wild-type P10 astrocytes (red) are seen spreading out over an stripped P10 ILM (perlecan green). (Q) The region indicated by the arrow in P at higher magnification. Scale bars: In I for A-D,F-I; in M for J-M; in Q for P,Q.

