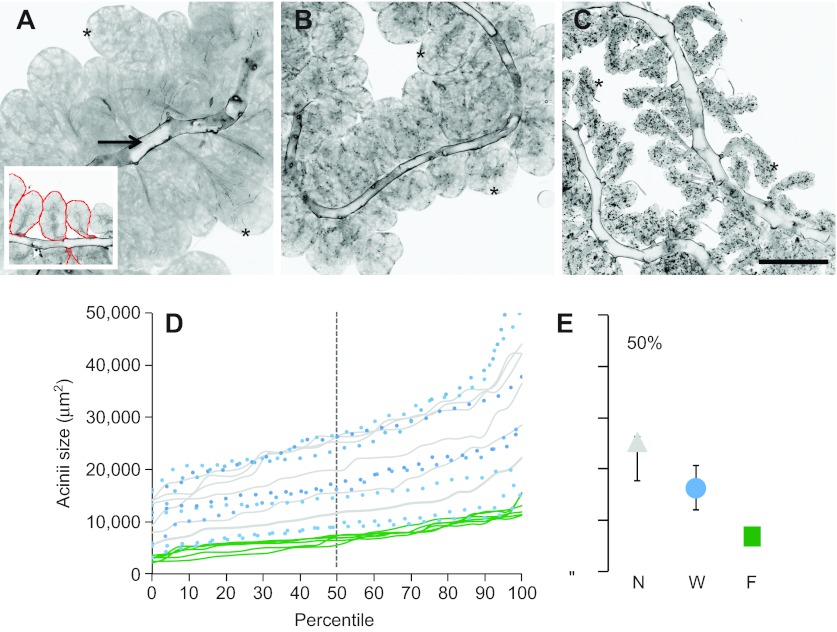
Fig. 5.
Acinii (‘units’) of HP glands are similar in size in old winter bees (W) and young controls (nest bees, N), but are significantly reduced in bees 14 days after foraging was initiated in the flight room (foragers, F). (A–C) Projection views of image stacks showing HP glands with single acinii (asterisks) and central ducts (arrow). Representative examples for young control (A), winter (B) and forager bees (C). The inset in A depicts reconstructed acinii as used for size measurements (N=28–30 area values per individual). (D) Acinii size distributions separately for all individuals, with size percentiles sorted from smallest to largest and the median value depicted by a vertical dashed line. Note that in contrast to foragers (green lines), the acinii size distributions differ considerably between individuals, both in young control (gray lines) and winter bees (blue circles). (E) Acinii size was significantly reduced in old foragers (F) compared with young nest bees (N; HW=7,F=6,N=7=12.74, P<0.01, KW; ZF=6,N=7=−3.00, P<0.01, MWU) and old winter bees (W; ZF=6,W=7=−3.00, P<0.01, MWU). Acinii size was not different between winter and young nest bees (ZW=7,N=7=−1.21, P=0.22, MWU). Medians and quartiles for all three phenotypes are displayed. For statistical details, see Table 1. Scale bar in C for A–C, 200 μm.

