
Figure 2.
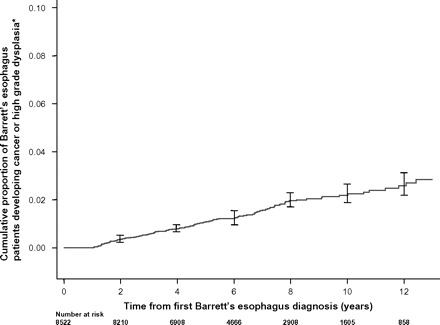
Kaplan–Meier plot showing the proportion of Barrett’s esophagus (BE) patients who developed esophageal or gastric cardia cancer or esophageal high-grade dysplasia relative to time from first diagnosis of BE. The asterisk denotes that individuals who developed cancer or high-grade dysplasia in the first year after diagnosis of BE were presumed to have had prevalent disease and were excluded from the study. In this graph, 95% confidence intervals are shown at biennial intervals.