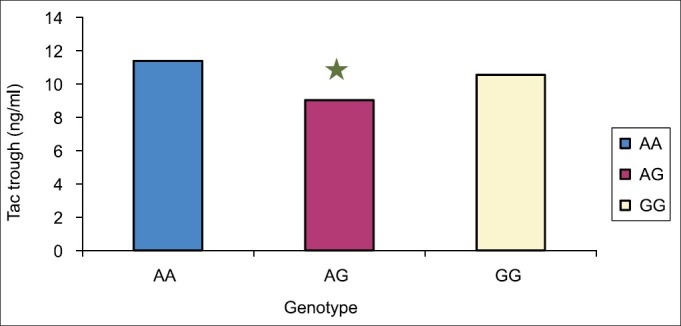
Figure 2.

Shows the mean tacrolimus concentration from day 2 to day 10 among 46 recipients. The mean tacrolimus concentration level was statistically significant higher in wild group (AA) versus heterozygote (AG) (P<0.006). However, there was no difference between AA and GG groups. *Significant difference from wild group (AA)
