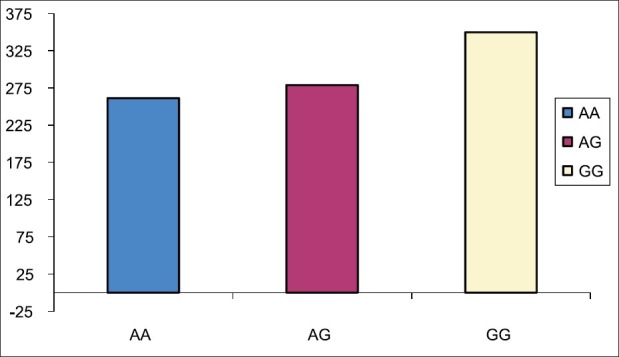
Figure 3.

The mean concentration/dosage ratio from day 2 to day 10 among 46 recipients. There were no statistically significant difference in all three genotype groups but GG group tend to have higher C/D ratio but not significant due to very small sample size in GG group (3 patients)
