Figure 1.

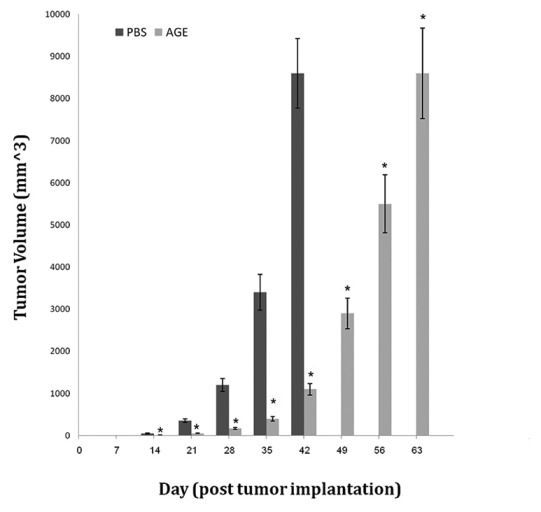
Tumor volume (mm3) with respect of time (day) stratified by treatment. *Significant difference in comparison to PBS group (P < 0.01)

Tumor volume (mm3) with respect of time (day) stratified by treatment. *Significant difference in comparison to PBS group (P < 0.01)