
Fig. 7.
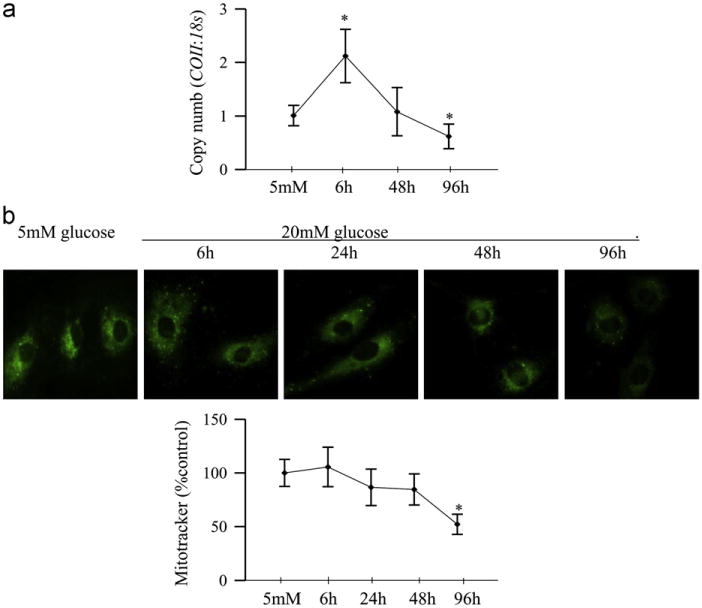
Effect of duration of high glucose on mitochondria copy number and mass. (a) Mitochondria copy number was assessed by real-time RT-PCR using 10 ng gDNA and primers for COII region of the mitochondria DNA; 18sRNA was used as a housekeeping gene. (b) Mitochondria number was quantified by staining the cells with MitoTracker green, and examining them under a Zeiss ApoTome using a 40x objective. The fluorescence was quantified using Image J software. Each measurement was made in duplicate using 2–3 different cell preparations. The accompanying histogram represents mean fluorescence under each condition. Values are represented as mean±SD. *P < 0.05 compared to 5 mM glucose.