
Figure 2.
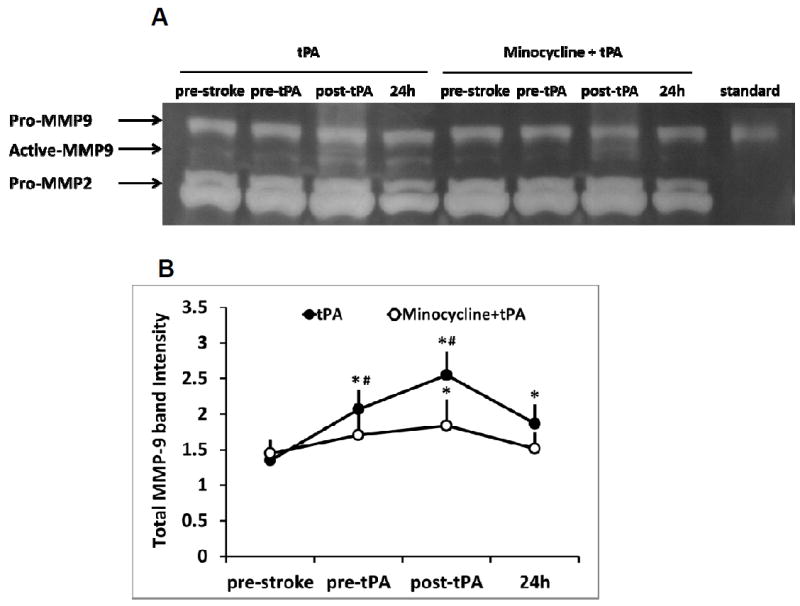
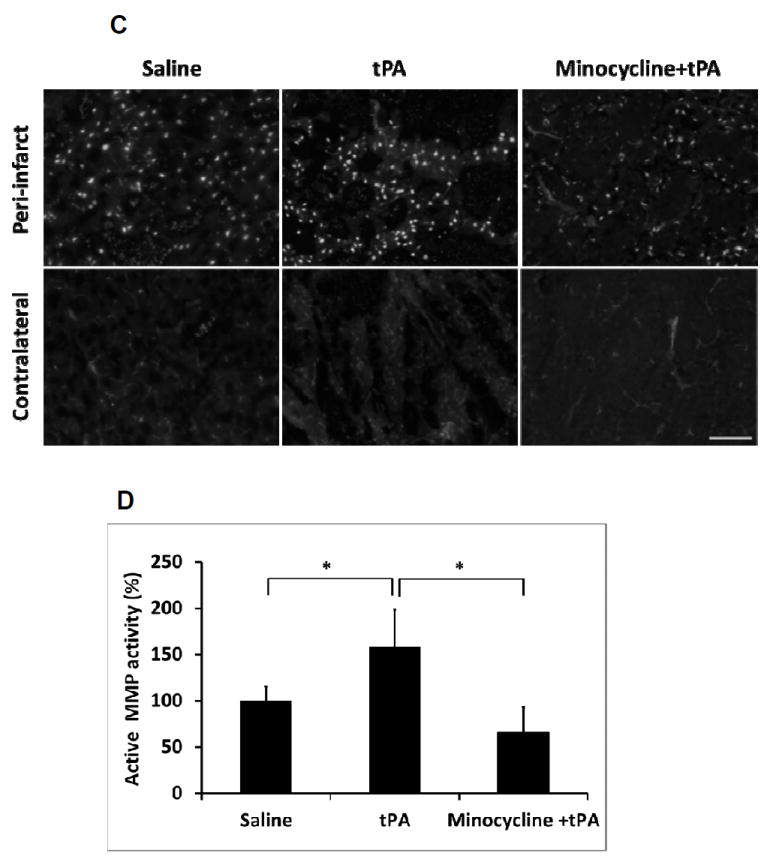
Measurements of MMP-9 activity in plasma and brain tissues of a focal embolic stroke model in diabetic rats. Plasma samples were collected before stroke (pre-stroke), 1.5 hours (pre-tPA), 2.5 hours (post-tPA) and 24 hours after stroke. A. Representative zymography comparing tPA vs minocycline plus tPA. B. Quantitative data of MMP-9 activity. Data were expressed as mean + s.d., *P<0.05 vs pre-stroke, # P<0.05 vs tPA treatment, n=6 per group. C. At 16 hours after stroke, representative MMP activity assessed by in situ zymography on rat brain sections treated with saline, tPA and minocycline combined with tPA, respectively. Bar=100 μm. D. Quantitative data analysis of MMP activity on brain sections. Data were expressed as mean + s.d., * P<0.05, n=3 per group.