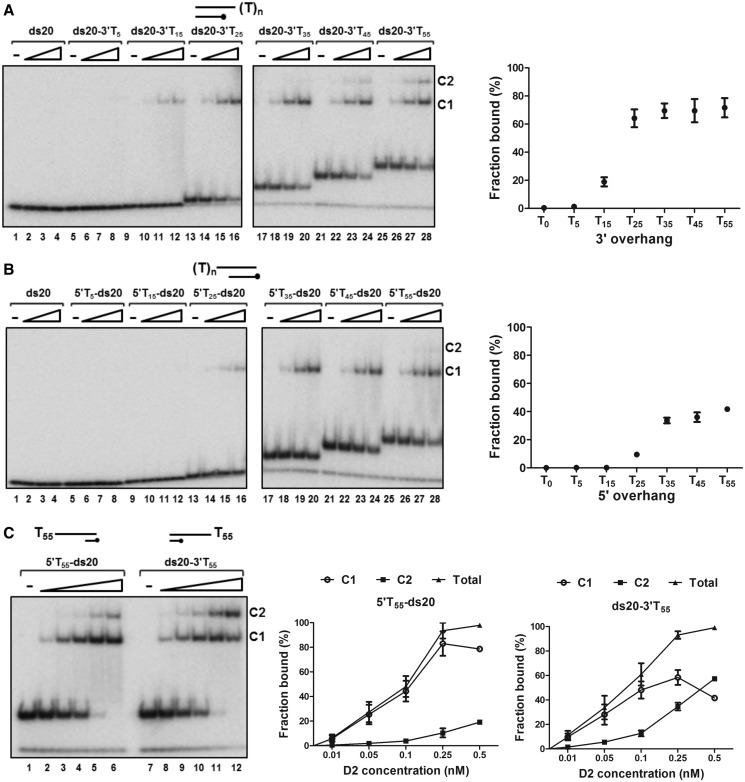
Figure 5.
D2 binding to partially single- and double-stranded DNA substrates. Reactions (0.05 nM DNA substrate, 0.01, 0.05 and 0.1 nM D2) were assembled and analysed by EMSA (n = 3, mean and SD). (A) Binding to 20 bp DNA substrates with 3′ T tails of increasing length. Complex formation was first observed with substrate ds20-3′T15 and increased significantly in extent when the tail length was increased. The increase in 3′ tail length from 35 to 55 residues promoted the formation of a second complex, C2. Quantitation of the binding data is shown for 0.1 nM D2 (total fraction of substrate bound, n = 3). (B) Binding to substrates with 5′ T tails. (C) Complex formation with D2 and a 20 bp DNA substrate with either a 5′ or 3′ 55-bp poly T overhang. D2 concentrations were increased up to 0.5 nM (0.01, 0.05, 0.1, 0.25 and 0.5 nM). The graphed data show total binding and the individual C1 and C2 components.

