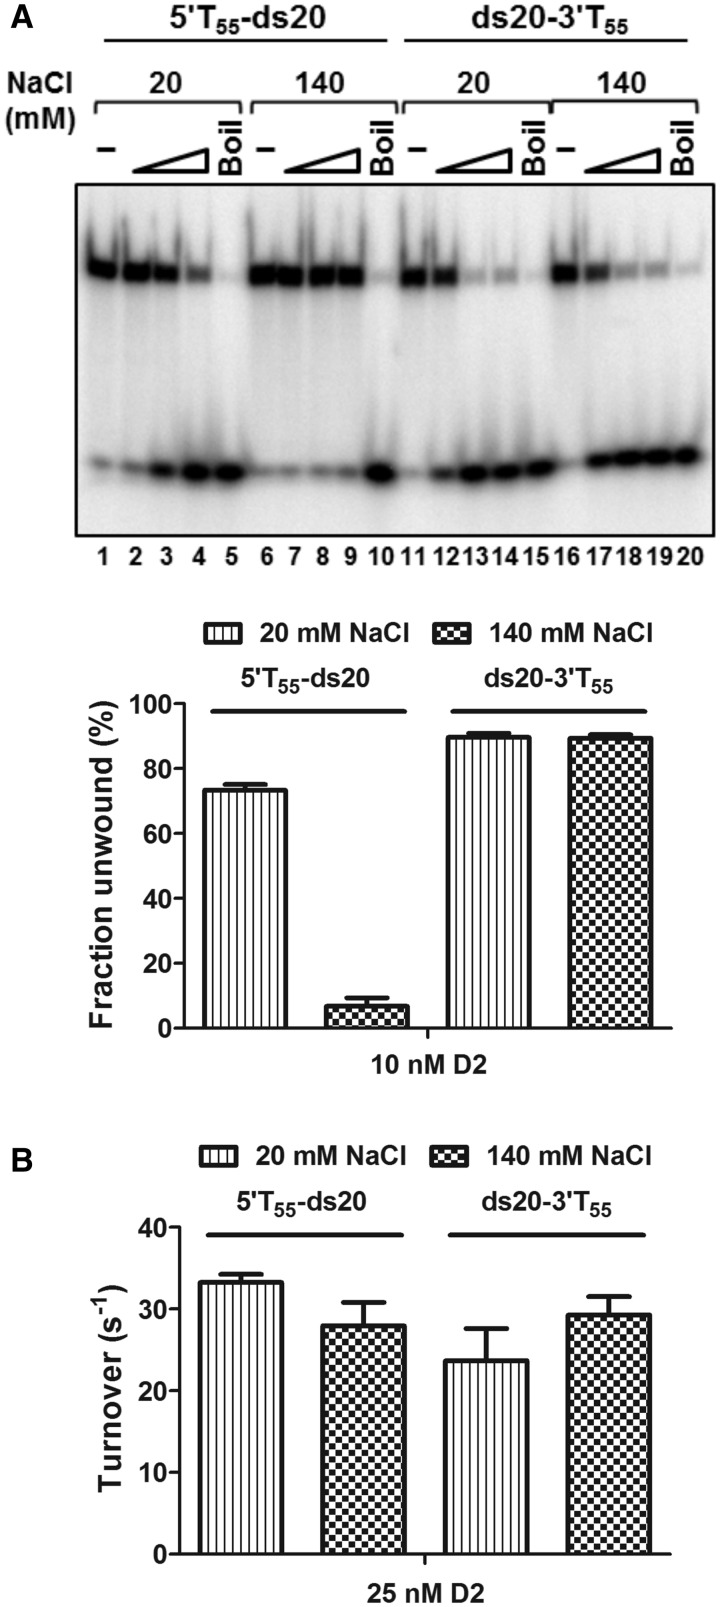
Figure 8.
Effect of NaCl concentration on the enzymatic activities of D2. (A) The unwinding of 5′T55-ds20 and ds20-3′T55 at 20 and 140 mM NaCl (n = 3, mean and SD). At 20 mM NaCl, D2 showed bipolar unwinding activity although with preferential unwinding of the substrate with a 3′ overhang (lanes 1–5 and lanes 11–15). At 140 mM NaCl, the 5′–3′ unwinding activity was almost completely inhibited (lanes 6–10), but not the 3′–5′ unwinding activity (lanes 16–20). The graphed data are for the highest concentration of D2 tested, 10 nM. (B) ATPase activity stimulated by 5′T55-ds20 and ds20-3′T55 (25 nM D2 and DNA, n = 3, mean and SD). Turnover numbers were calculated from the 5-min time point by dividing the amount of product formed by the molar quantity of enzyme and time in seconds: 5′T55-ds20, 33.3 ± 1 s −1 and 28 ± 2.9 s−1; ds20-3′T55, 23.7 ± 3.9 s−1 and 29.3 ± 2.2 s−1 at 20 and 140 mM NaCl, respectively.

