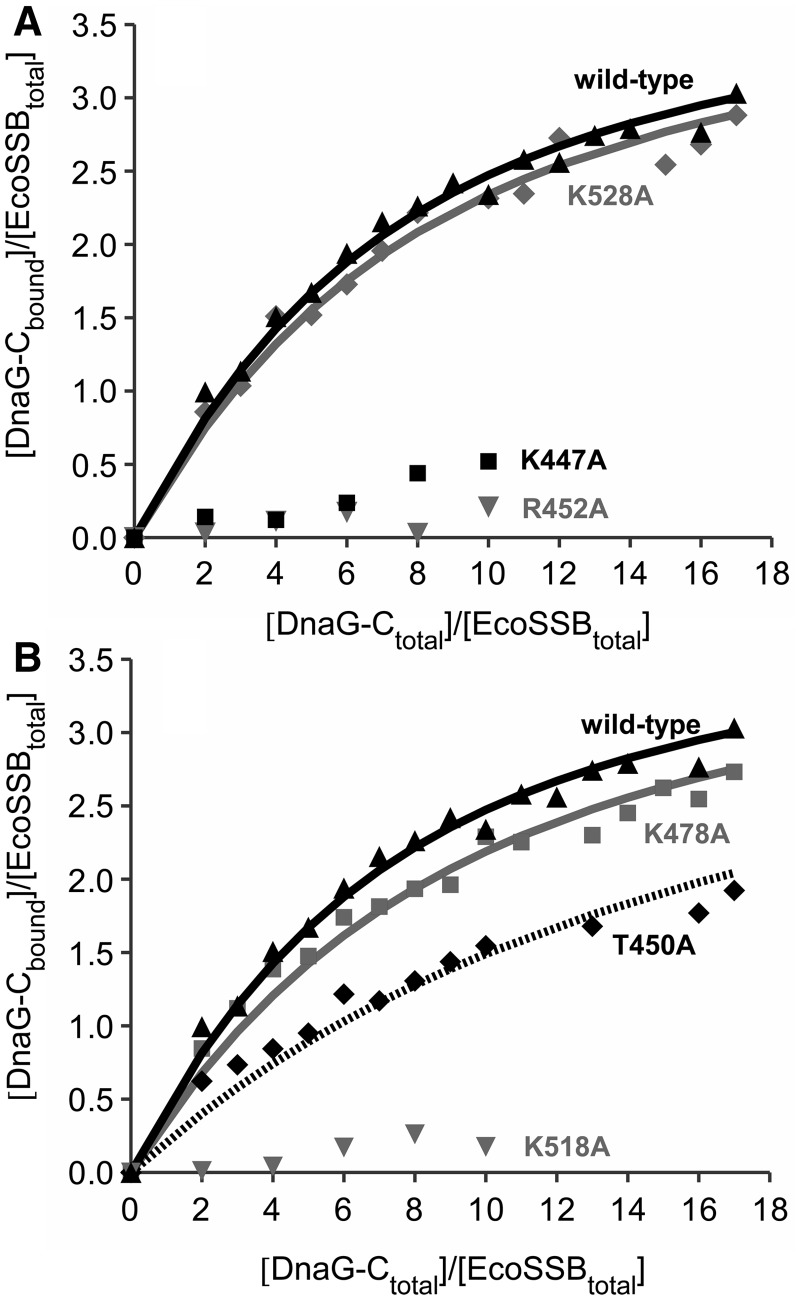
Figure 3.
Interaction of DnaG-C mutants with SSB. EcoSSB (2.5 µM) was mixed with different amounts of DnaG-C variants in low salt buffer and analysed in sedimentation velocity experiments in an analytical ultracentrifuge. Lines represent theoretical binding isotherms calculated for a simple interaction model of one EcoSSB tetramer binding four DnaG-C molecules with the association constants given below. For comparison, a binding isotherm of the interaction of EcoSSB and DnaG-C wild-type (black triangles) with KA = 8.6 × 10⁴ M−1 is shown in both parts of the figure (solid black line). (A) Replacing K528 by alanine (diamonds) did not significantly change the affinity of DnaG-C to SSB (solid grey line: KA = 7.4 × 10⁴ M−1). Exchanging K447 to alanine (squares), however, had a strong effect on the SSB/DnaG-C interaction. Moreover, the R452A mutation dramatically lowered the binding affinity to SSB (grey triangles). (B) DnaG-C K478A (squares) behaved similarly to wild-type protein (solid grey line: KA = 6.2 × 10⁴ M−1), whereas an exchange of K518 to alanine dramatically decreased the binding affinity to SSB (grey triangles). The T450A mutation (diamonds) lowered the affinity by a factor of three (dashed line: KA = 2.8 × 10⁴ M−1).

